Categories: Technical analysis

PZZA Wave Analysis – 17 June 2025

PZZA: ⬇️ Sell

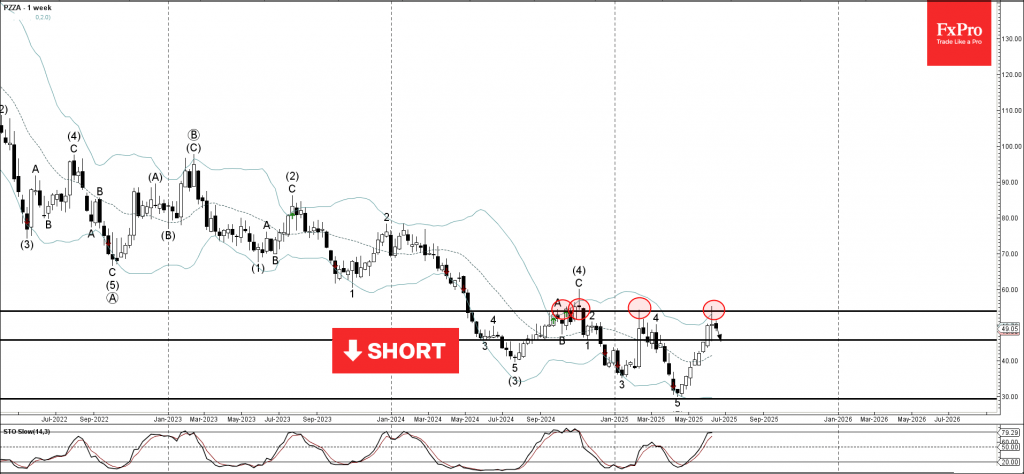
– PZZA reversed from key resistance level 53.90

– Likely to fall to support level 45.85

PZZA recently reversed down from the key resistance level 53.90 (which has been steadily reversing the price from the end of 2024), intersecting with the upper weekly Bollinger Band.

The downward reversal from the resistance level 53.90 formed the weekly Japanese candlesticks reversal pattern Long-legged Doji – a strong sell signal for PZZA.

Given the clear long-term downtrend and the overbought weekly Stochastic, PZZA can be expected to fall to the next support level 45.85.

The FxPro Tech Analysis Team

The FxPro technical experts prepare a daily analysis of the most active currency pairs (majors, crosses, exotics) and commodities. Selected instruments are reviewed on daily trends (D1, H4), using the active Elliott Wave setups, Japanese candlesticks, indicators, and support/resistance levels.

Share
Published by
The FxPro Tech Analysis Team
Tags: PZZA

Recent Posts

CHFJPY Wave Analysis – 9 January 2026

CHFJPY: ⬆️ Buy - CHFJPY reversed from support area - Likely to rise to resistance…

3 hours ago

Exxon Mobil Wave Analysis – 9 January 2026

Exxon Mobil: ⬆️ Buy - Exxon Mobil reversed from support area - Likely to rise…

3 hours ago

Pro News Weekly: Dollar Rebounds as Markets Test New Limits

Welcome to Pro News Weekly! Here’s what is shaping the markets: 💵 The U.S. dollar…

7 hours ago

Geopolitics will destroy the euro

•    EURUSD falls due to geopolitics and expectations of tariff removal •    Gold returns to…

14 hours ago

Platinum Wave Analysis – 8 January 2026

Platinum: ⬇️ Sell - Platinum reversed from pivotal resistance level 150.00 - Likely to fall to…

1 day ago

Baidu Wave Analysis – 8 January 2026

Baidu: ⬇️ Sell - Baidu reversed from resistance zone - Likely to fall to support level…

1 day ago

This website uses cookies