Categories: Technical analysis

Procter & Gamble Wave Analysis 16 December, 2020

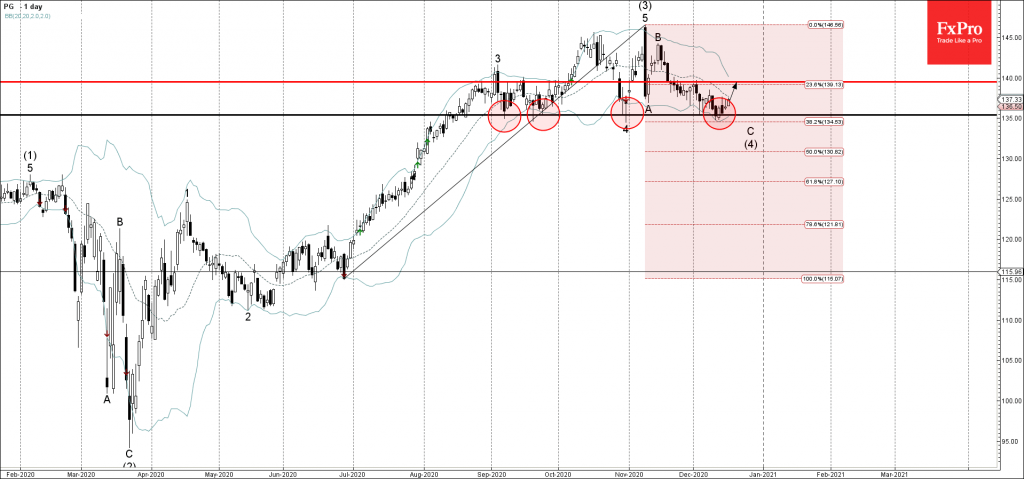
• Procter & Gamble reversed from support level 134.70

• Likely to rise to 139.50

Procter & Gamble recently reversed up from the pivotal support level 134.70 (which has been repeatedly reversing the price from the middle of August).

The support area near the support level 134.70 was strengthened by the lower daily Bollinger Band and by 38.2% Fibonacci retracement of the previous upward impulse from June.

Procter & Gamble is expected to rise further toward the next resistance level 139.50 (top of the previous minor retracement from the start of December).

The FxPro Tech Analysis Team

The FxPro technical experts prepare a daily analysis of the most active currency pairs (majors, crosses, exotics) and commodities. Selected instruments are reviewed on daily trends (D1, H4), using the active Elliott Wave setups, Japanese candlesticks, indicators, and support/resistance levels.

Share
Published by
The FxPro Tech Analysis Team
Tags: PG

Recent Posts

NZDCAD Wave Analysis – 7 January 2026

NZDCAD: ⬆️ Buy - NZDCAD reversed from support zone - Likely to rise to resistance…

3 hours ago

Bitcoin Wave Analysis – 7 January 2026

Bitcoin: ⬇️ Sell - Bitcoin reversed from resistance zone - Likely to fall to support…

3 hours ago

EURGBP Wave Analysis – 7 January 2026

EURGBP: ⬆️ Buy - EURGBP reversed from support zone - Likely to rise to resistance…

3 hours ago

Brent Crude Oil Wave Analysis – 7 January 2026

Brent Crude Oil: ⬇️ Sell - Brent Crude Oil reversed from resistance zone - Likely…

3 hours ago

Old fears about the euro have returned

The resurgence of the political crisis in France is weighing on EURUSD The US dollar…

12 hours ago

The crypto market has hit the upper limit of its rebound

The crypto market faces resistance at $3.2T; sentiment rises, but selling pressure persists. Bitcoin and…

15 hours ago

This website uses cookies