Categories: Technical analysis

Platinum Wave Analysis – 31 December, 2019

  • Platinum broke the resistance area
  • Likely to rise to 1000.00

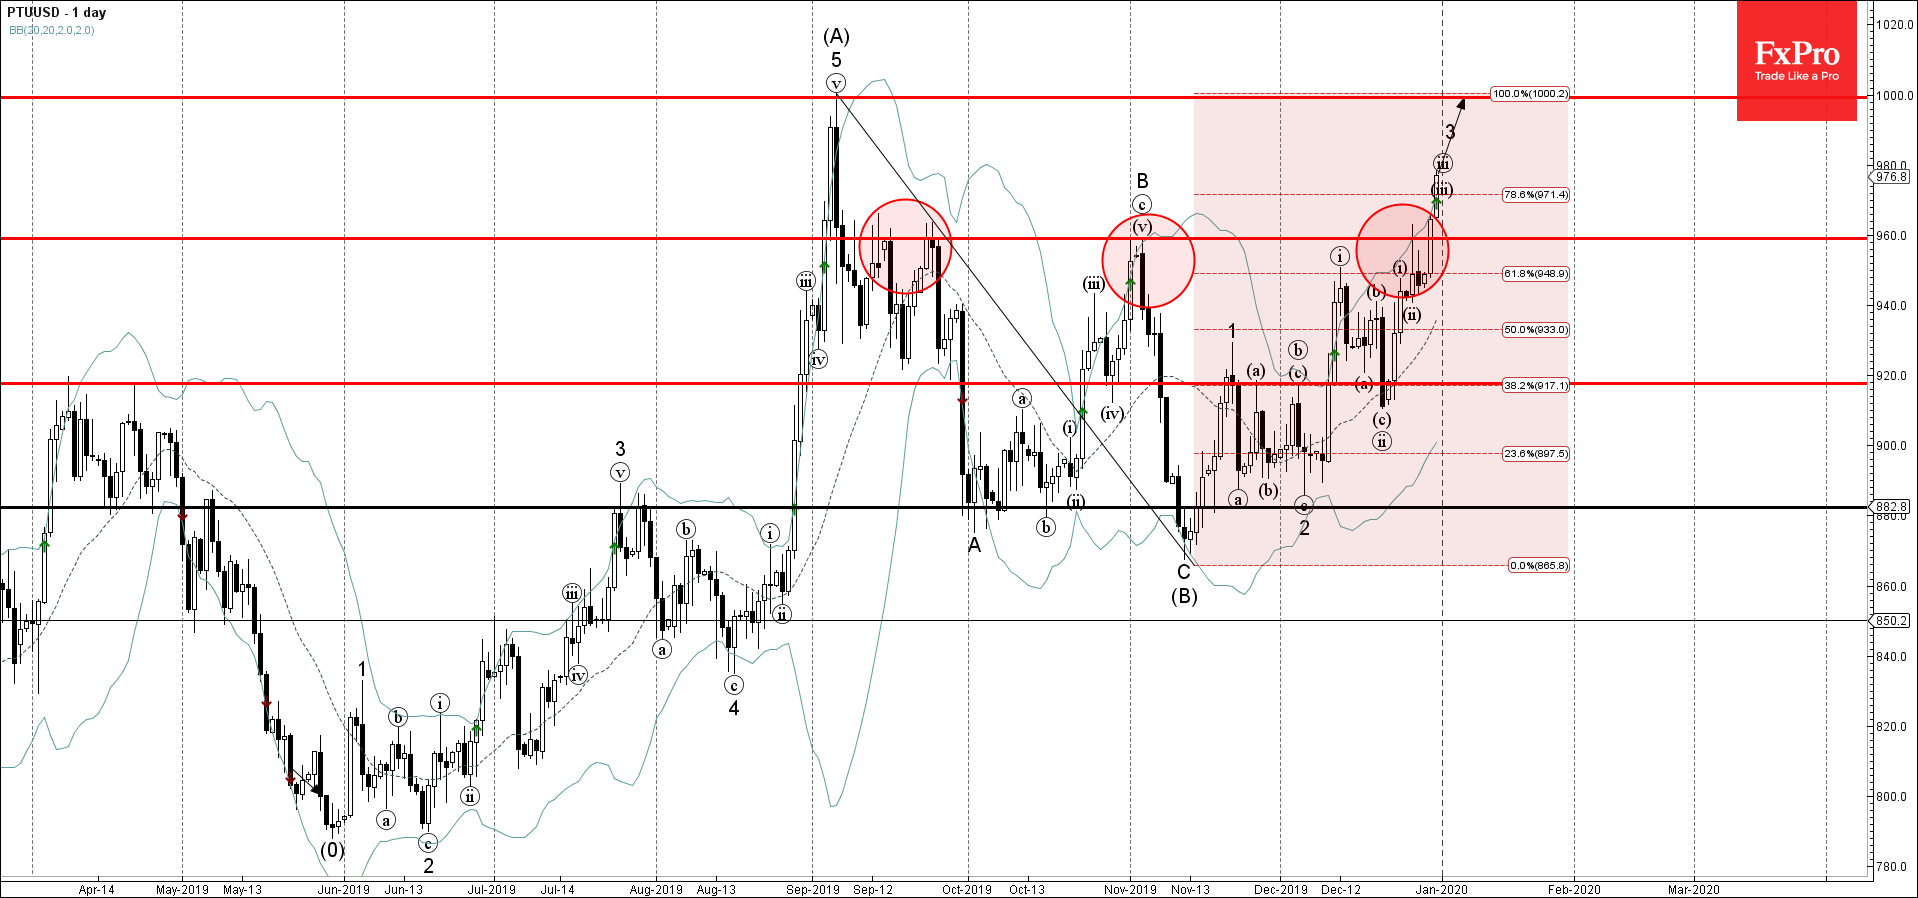
Platinum recently broke the resistance area lying between resistance level 960.00 (which has been reversing the price from September) and the 61.8% Fibonacci correction of the previous ABC correction (B) from September.

The breakout of this resistance area accelerated the active impulse waves 3 and (C).

Platinum is expected to rise further toward the next strong round resistance level 1000.00 (which stopped the sharp uptrend in September) – from where the price is likely to correct down.

The FxPro Tech Analysis Team

The FxPro technical experts prepare a daily analysis of the most active currency pairs (majors, crosses, exotics) and commodities. Selected instruments are reviewed on daily trends (D1, H4), using the active Elliott Wave setups, Japanese candlesticks, indicators, and support/resistance levels.

Share
Published by
The FxPro Tech Analysis Team
Tags: PTUUSD

Recent Posts

Persisting pressure on crypto 

Market picture  The crypto market has lost 2% of its capitalisation over the last 24…

3 hours ago

S&P 500 Wave Analysis 7 May 2024

- S&P 500 reversed from support level 5000.00 - Likely to rise to resistance level…

17 hours ago

USDCHF Wave Analysis 7 May 2024

- USDCHF reversed from support zone - Likely to rise to resistance level 0.9200 USDCHF…

17 hours ago

EURUSD at the equilibrium, where will it go next?

The single currency is trading near $1.076, waiting for further cues and facing serious resistance…

21 hours ago

Bitcoin can’t accelerate but won’t give up trying

Market picture  The crypto market capitalisation fell by 1.7% in 24 hours to $2.29 trillion,…

1 day ago

USDJPY Wave Analysis 6 May 2024

- USDJPY reversed from support zone - Likely to rise to resistance level 155.65 USDJPY…

2 days ago

This website uses cookies