Categories: Technical analysis

Platinum Wave Analysis 10 March, 2021

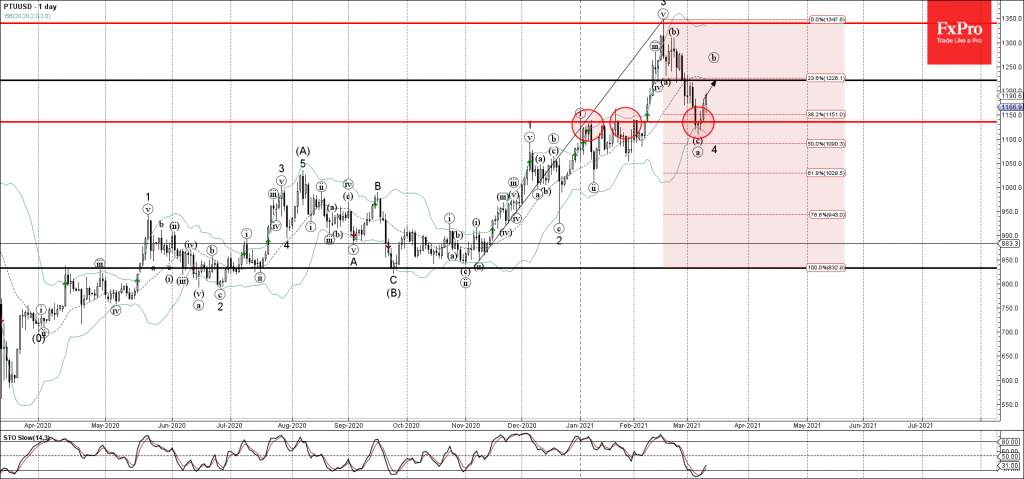
• Platinum reversed from support area

• Likely to rise to resistance level 1220.00

Platinum recently reversed up from the support zone located between the key support level 1135.00 (former resistance from January), lower daily Bollinger Band and the 38.2% Fibonacci correction of the upward impulse from November.

The upward reversal from this support zone started the active short-term corrective wave (b).

Given the prevailing daily uptrend – Platinum is likely to rise further in the active wave (b) toward the next resistance level 1220.00.

The FxPro Tech Analysis Team

The FxPro technical experts prepare a daily analysis of the most active currency pairs (majors, crosses, exotics) and commodities. Selected instruments are reviewed on daily trends (D1, H4), using the active Elliott Wave setups, Japanese candlesticks, indicators, and support/resistance levels.

Share
Published by
The FxPro Tech Analysis Team
Tags: platinum

Recent Posts

Oil Bounces Locally, Global Support 5% below Spot Price 

The number of operating oil rigs in the US fell by 7 to 499. This…

24 mins ago

Crypto Market Tries to Break Local Downtrend

Market picture  Crypto market capitalisation has been up 2% over the past seven days and…

7 hours ago

Adobe Wave Analysis 3 May 2024

- Adobe reversed from support zone - Likely to rise to resistance level 500.00 Adobe…

3 days ago

EURGBP Wave Analysis 3 May 2024

- EURGBP reversed from support zone - Likely to rise to resistance level 0.8625 EURGBP…

3 days ago

How Low Can the USDJPY Go?

USDJPY was slipping below 153 on Friday morning, a three-week low and having lost over…

3 days ago

Bitcoin’s Downtrend, Solana and Ethereum Form Double Bottom

Market picture  Crypto market capitalisation rose 3.3% in 24 hours to $2.22 trillion. Local capitalisation…

3 days ago

This website uses cookies