Categories: Technical analysis

Platinum Wave Analysis – 03 April, 2019

  • Platinum reversed from support area
  • Further gains are likely

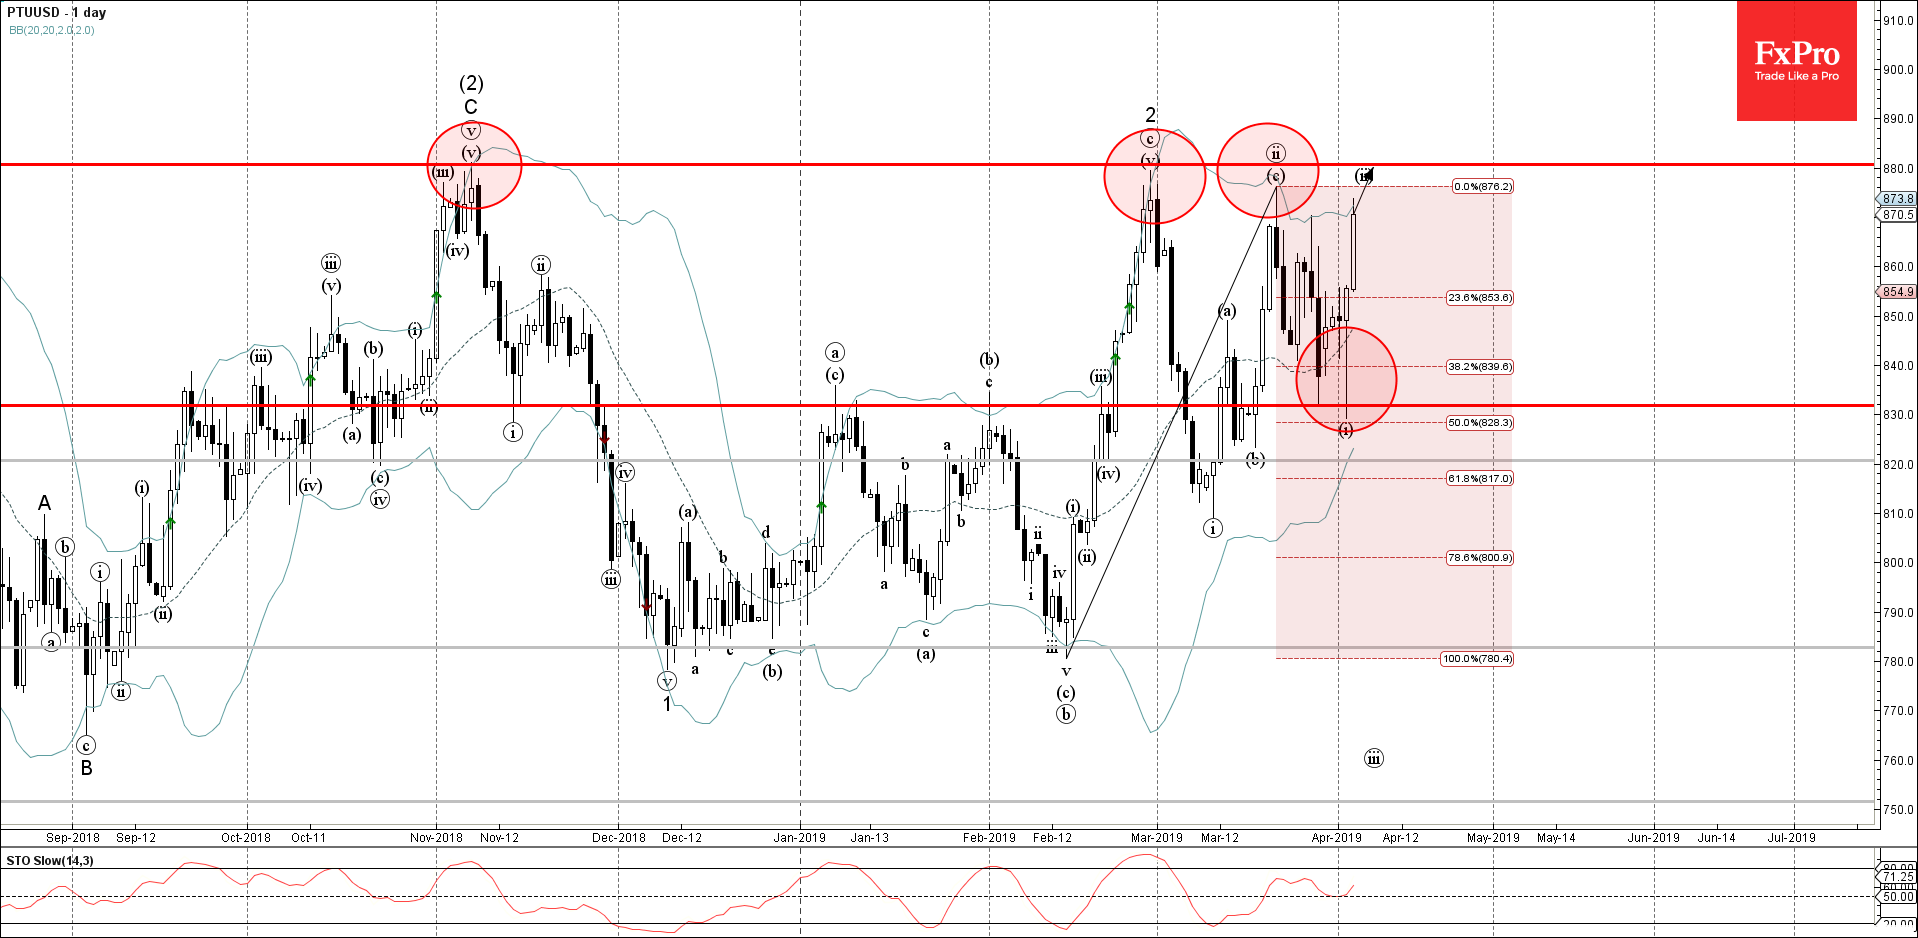
Platinum recently reversed up from the support area lying between the key support level 830.00 (which also reversed the price at the end of March) and lower daily Bollinger Band.

The upward reversal from this support area created the daily Japanese candlesticks reversal pattern Hammer, highlighted below.

Platinum is expected to rise further and re-test the next resistance level 880.00 (which has been reversing the price from November).

The FxPro Tech Analysis Team

The FxPro technical experts prepare a daily analysis of the most active currency pairs (majors, crosses, exotics) and commodities. Selected instruments are reviewed on daily trends (D1, H4), using the active Elliott Wave setups, Japanese candlesticks, indicators, and support/resistance levels.

Share
Published by
The FxPro Tech Analysis Team
Tags: PTUUSD

Recent Posts

WTI crude oil Wave Analysis 8 May 2024

- WTI crude oil reversed from support area - Likely to rise to resistance level…

2 hours ago

AUDJPY Wave Analysis 8 May 2024

- AUDJPY reversed from support area - Likely to rise to resistance level 103.00 AUDJPY…

2 hours ago

German industrial production slide brings closer ECB’s rate cut

German industrial production continues to decline. The rate of contraction in March was slightly better…

8 hours ago

US indices are heading towards highs

US indices have been gaining daily since the beginning of May. They have found strength…

10 hours ago

Persisting pressure on crypto

Market picture  The crypto market has lost 2% of its capitalisation over the last 24…

13 hours ago

S&P 500 Wave Analysis 7 May 2024

- S&P 500 reversed from support level 5000.00 - Likely to rise to resistance level…

1 day ago

This website uses cookies