Categories: Technical analysis

Pfizer Wave Analysis – 23 March, 2020

  • Pfizer approached key support level 28.25
  • Likely to correct up to 30.00

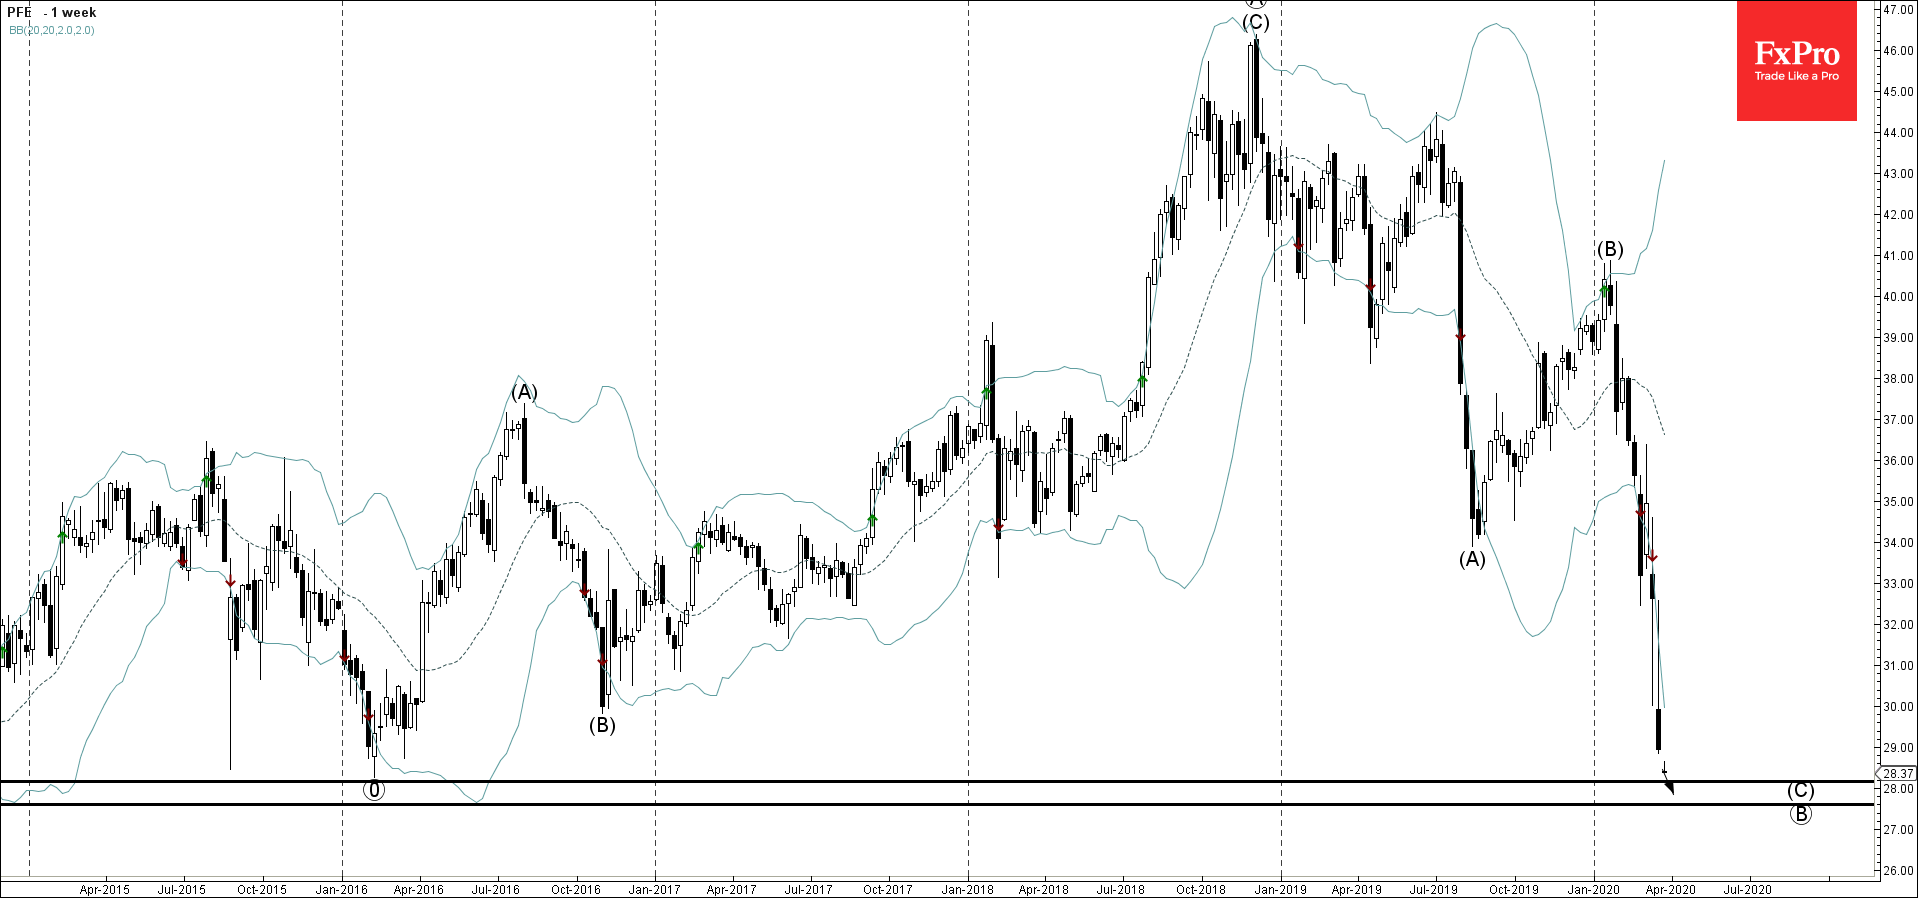
Pfizer recently fell sharply breaking through the round support level 30.00 (which stopped the earlier downward correction (B) at the end of 2016).

The price is currently trading close to the major support level 28.25 (which started the sharp uptrend at the start of 2016, as can be seen below).

Given the strength of the support level 28.25  – Pfizer might correct up to the next resistance level 30.00 in the neatest time. If the price breaks below 28.25 – Pfizer will then, most likely, test the next support level 27.60.

The FxPro Tech Analysis Team

The FxPro technical experts prepare a daily analysis of the most active currency pairs (majors, crosses, exotics) and commodities. Selected instruments are reviewed on daily trends (D1, H4), using the active Elliott Wave setups, Japanese candlesticks, indicators, and support/resistance levels.

Share
Published by
The FxPro Tech Analysis Team
Tags: PFE

Recent Posts

The dollar does not tolerate dissent

US GDP growth is driven not by the White House, but by AI. The Bank…

8 hours ago

The crypto market has made a breakthrough

The crypto market surges, hitting new highs, with bullish sentiment for Bitcoin and Ethereum amid…

8 hours ago

Brent Crude oil Wave Analysis – 13 January 2026

Brent Crude oil ⬆️ Buy - Brent Crude oil rising inside impulse wave c -…

22 hours ago

USDJPY Wave Analysis – 13 January 2026

USDJPY ⬆️ Buy - USDJPY broke resistance area - Likely to rise to resistance level…

22 hours ago

Exxon Mobil Wave Analysis – 13 January 2026

Exxon Mobil ⬆️ Buy - Exxon Mobil broke resistance level 125.60 - Likely to rise…

22 hours ago

BNB Wave Analysis – 13 January 2026

Brent Crude oil ⬆️ Buy - BNB broke out of sideways price range - Likely…

22 hours ago

This website uses cookies