Categories: Technical analysis

Palladium Wave Analysis – 9 July, 2019

  • Palladium reversed from resistance area
  • Further losses are likely

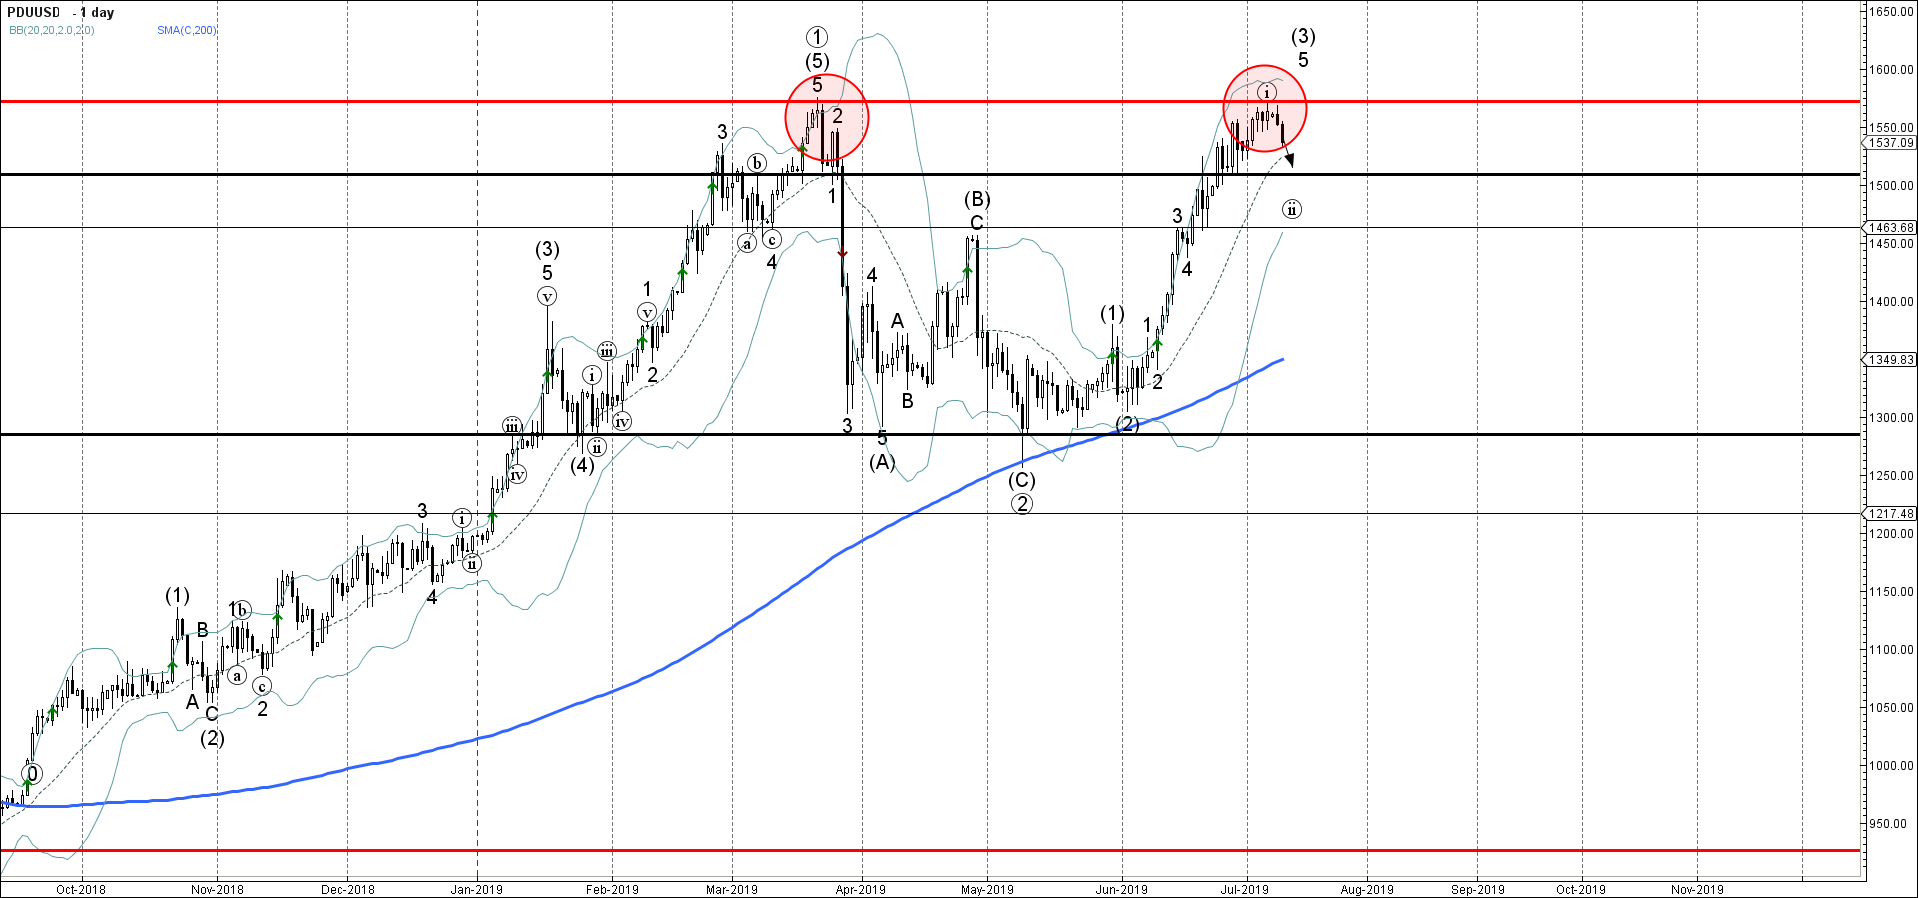
Palladium recently reversed down from the resistance area lying between the strong resistance level 1570.00 (which stopped the sharp uptrend in March) and the upper daily Bollinger Band.

The downward reversal from this resistance area started the active short-term corrective wave (ii).

Palladium is expected to fall further and retest the next support level 1509.00 (former support from the end of June).

AddThis Website Tools
The FxPro Tech Analysis Team

The FxPro technical experts prepare a daily analysis of the most active currency pairs (majors, crosses, exotics) and commodities. Selected instruments are reviewed on daily trends (D1, H4), using the active Elliott Wave setups, Japanese candlesticks, indicators, and support/resistance levels.

Share
Published by
The FxPro Tech Analysis Team
Tags: PDUUSD

Recent Posts

GBPUSD Wave Analysis – 18 March 2025

GBPUSD: ⬆️ Buy - GBPUSD reversed from support zone - Likely to rise to resistance…

1 hour ago

GBPAUD Wave Analysis – 18 March 2025

GBPAUD: ⬆️ Buy - GBPAUD reversed from the support zone - Likely to rise to…

1 hour ago

Solana Wave Analysis – 18 March 2025

Solana: ⬇️ Sell - Solana reversed from the resistance zone - Likely to fall to…

3 hours ago

CHFJPY Wave Analysis – 18 March 2025

CHFJPY: ⬆️ Buy - CHFJPY broke resistance zone - Likely to rise to resistance level…

3 hours ago

The crypto market is stuck in the mud

Market Picture The crypto market has been hovering in a narrow range for the past…

8 hours ago

FTSE 100 Wave Analysis – 17 March 2025

FTSE 100: ⬆️ Buy - FTSE 100 reversed from key support level 8425.00 - Likely…

1 day ago