Categories: Technical analysis

Palladium Wave Analysis – 4 September, 2020

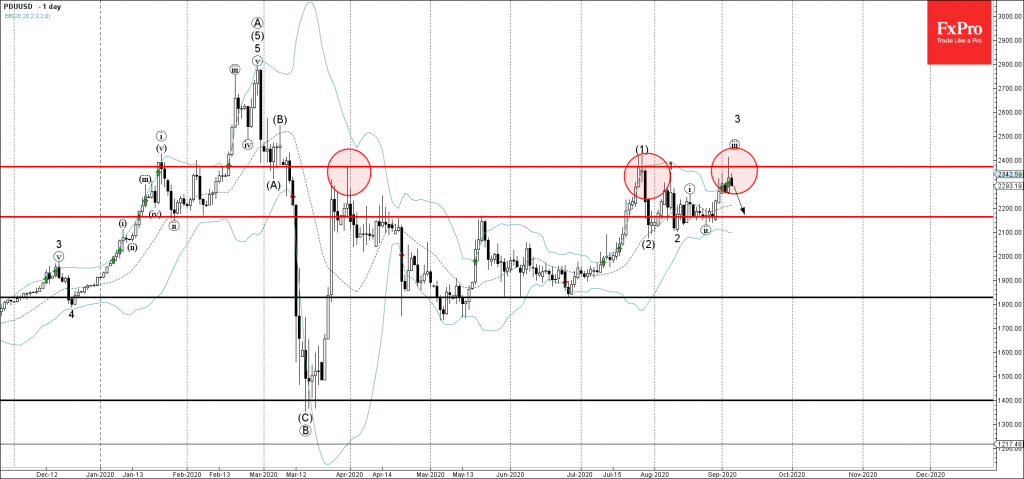
• Palladium reversed from resistance level 2370,00

• Likely to fall to 2130,00

Palladium recently reversed down with the daily Shooting Star from the powerful resistance level 2370,00 (which has been reversing the price form March).

The downward reversal from the resistance level 2370.00 stopped the previous upward impulse sequence (iii) from the end of August.

Palladium is likely to fall further toward the next support level 2130,00 (which stopped the two previous corrections (ii) and 2 in August).

The FxPro Tech Analysis Team

The FxPro technical experts prepare a daily analysis of the most active currency pairs (majors, crosses, exotics) and commodities. Selected instruments are reviewed on daily trends (D1, H4), using the active Elliott Wave setups, Japanese candlesticks, indicators, and support/resistance levels.

Share
Published by
The FxPro Tech Analysis Team
Tags: PDUUSD

Recent Posts

Baidu Wave Analysis – 11 April 2025

Baidu: ⬆️ Buy - Baidu reversed from support zone - Likely to rise to resistance level…

3 days ago

USDCAD Wave Analysis – 11 April 2025

USDCAD: ⬇️ Sell - USDCAD broke support zone - Likely to fall to support level…

3 days ago

Video: Massive Market Reversal or Total Collapse? The Charts Are Screaming…

We break down one of the most dramatic weeks in the markets — including a…

3 days ago

US Dollar Suffers Amidst Inflation Data and Expectations

The US dollar is suffering due to weaker than expected inflation data and a surge…

3 days ago

USDJPY Wave Analysis – 11 April 2025

USDJPY: ⬇️ Sell - USDJPY broke the support zone - Likely to fall to support…

3 days ago

Bitcoin Wave Analysis – 11 April 2025

Bitcoin: ⬆️ Buy - Bitcoin reversed from support zone - Likely to rise to resistance…

3 days ago

This website uses cookies