Categories: Technical analysis

Palladium Wave Analysis – 28 September , 2018

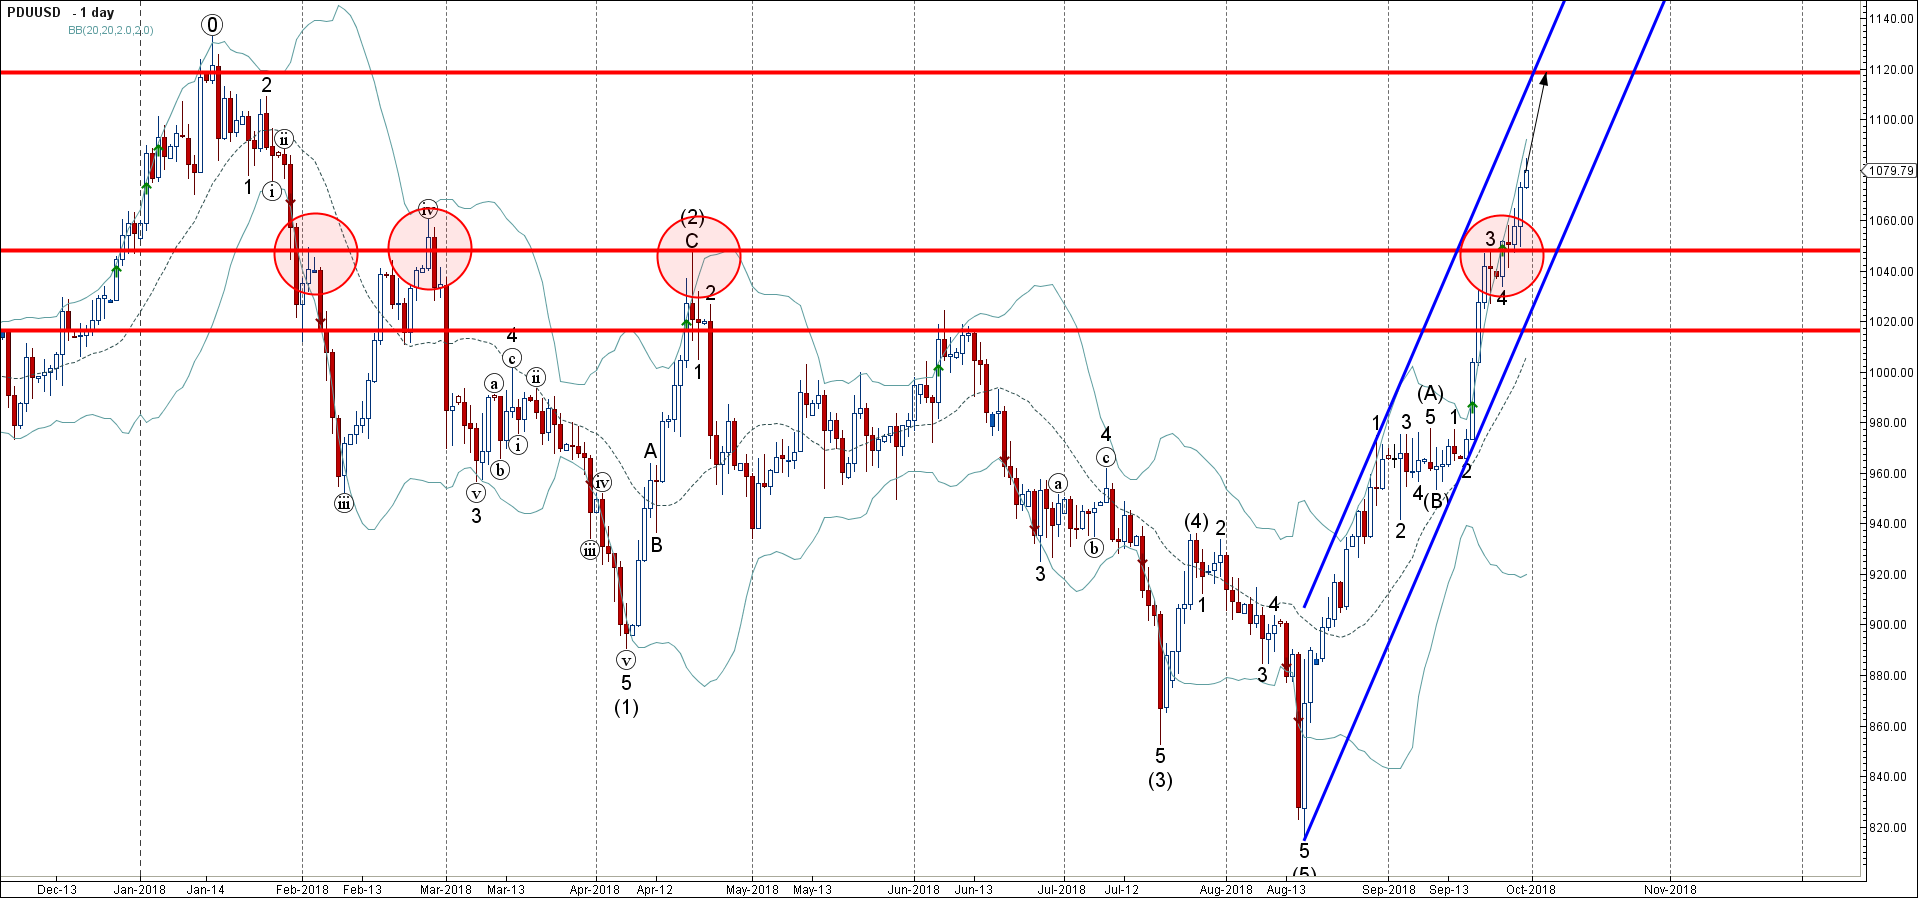
  • Palladium broke long-term resistance level 1050.00
  • Further gains are likely

Palladium continues to rise after the earlier breakout of the strong, long-term resistance level 1050.00 (which has been reversing the price from the start of February).

The breakout of the resistance level 1050.00 accelerated the active short-term impulse wave 5, which belongs to the medium-term impulse wave (C) from the start of September.

Palladium is expected to rise further and retest the next powerful resistance level 1120.00 (which stopped the sharp uptrend in January of this year).

PDUUSD

The FxPro Tech Analysis Team

The FxPro technical experts prepare a daily analysis of the most active currency pairs (majors, crosses, exotics) and commodities. Selected instruments are reviewed on daily trends (D1, H4), using the active Elliott Wave setups, Japanese candlesticks, indicators, and support/resistance levels.

Share
Published by
The FxPro Tech Analysis Team
Tags: PDUUSD

Recent Posts

CHFJPY Wave Analysis – 9 January 2026

CHFJPY: ⬆️ Buy - CHFJPY reversed from support area - Likely to rise to resistance…

3 hours ago

Exxon Mobil Wave Analysis – 9 January 2026

Exxon Mobil: ⬆️ Buy - Exxon Mobil reversed from support area - Likely to rise…

3 hours ago

Pro News Weekly: Dollar Rebounds as Markets Test New Limits

Welcome to Pro News Weekly! Here’s what is shaping the markets: 💵 The U.S. dollar…

7 hours ago

Geopolitics will destroy the euro

•    EURUSD falls due to geopolitics and expectations of tariff removal •    Gold returns to…

14 hours ago

Platinum Wave Analysis – 8 January 2026

Platinum: ⬇️ Sell - Platinum reversed from pivotal resistance level 150.00 - Likely to fall to…

1 day ago

Baidu Wave Analysis – 8 January 2026

Baidu: ⬇️ Sell - Baidu reversed from resistance zone - Likely to fall to support level…

1 day ago

This website uses cookies