Categories: Technical analysis

Palladium Wave Analysis – 26 September, 2019

  • Palladium reversed from support area
  • Likely to rise to 1645.00

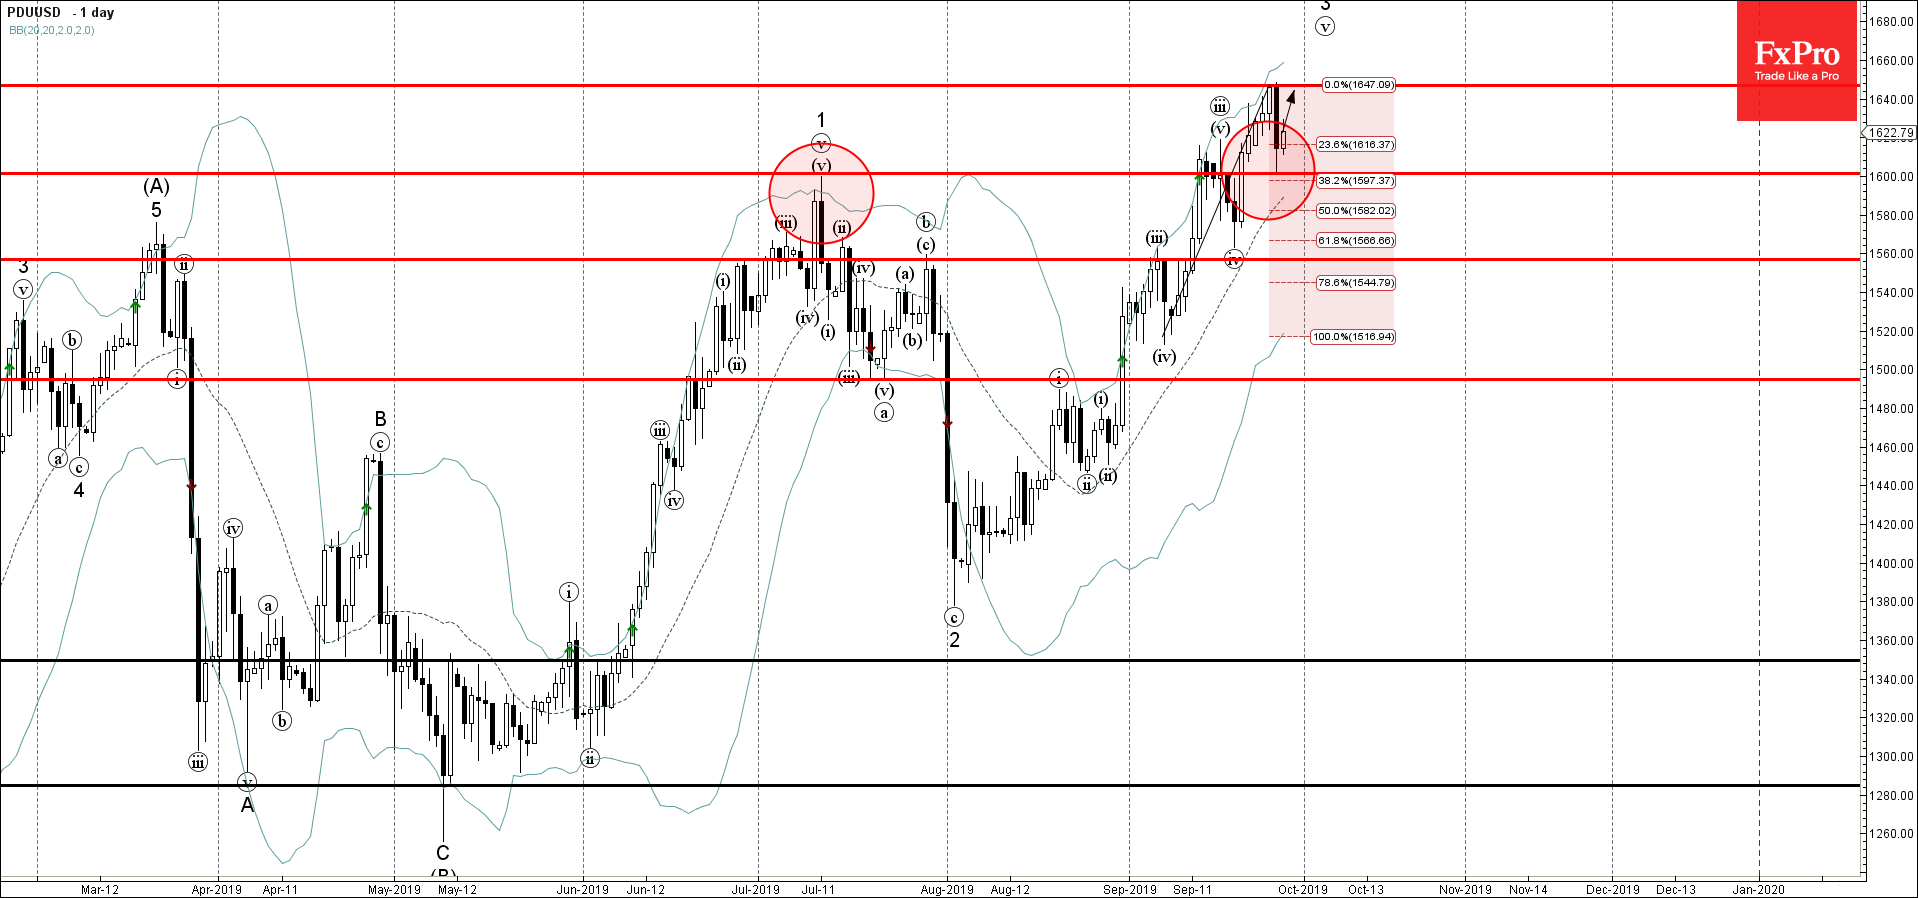
Palladium recently reversed up from the support area lying between the round support level 1.600 (former multi-month resistance level which stopped the sharp uptrend in June) and the 38.2% Fibonacci correction of the previous upward impulse from September.

The upward reversal from this support area continues the active short-term impulse wave 3 of the medium-term upward impulse sequence (C) from May.

Palladium is expected to rise further and retest the next resistance level 1645.00 (which reversed the price earlier this month).

The FxPro Tech Analysis Team

The FxPro technical experts prepare a daily analysis of the most active currency pairs (majors, crosses, exotics) and commodities. Selected instruments are reviewed on daily trends (D1, H4), using the active Elliott Wave setups, Japanese candlesticks, indicators, and support/resistance levels.

Share
Published by
The FxPro Tech Analysis Team
Tags: PDUUSD

Recent Posts

The crypto market is stuck in the mud

Market Picture The crypto market has been hovering in a narrow range for the past…

2 hours ago

FTSE 100 Wave Analysis – 17 March 2025

FTSE 100: ⬆️ Buy - FTSE 100 reversed from key support level 8425.00 - Likely…

18 hours ago

Alibaba Wave Analysis – 17 March 2025

Alibaba: ⬆️ Buy - Alibaba broke the key resistance level 145.00 - Likely to rise…

18 hours ago

EURNZD Wave Analysis – 17 March 2025

EURNZD: ⬇️ Sell - EURNZD reversed from long-term resistance level 1.9160 - Likely to fall…

22 hours ago

AUDUSD Wave Analysis – 17 March 2025

AUDUSD: ⬆️ Buy - AUDUSD broke resistance level 0.6350 - Likely to rise to resistance…

22 hours ago

Weak US retail sales might boost stocks

Weak US retail sales are adding to concerns of a potential recession, putting pressure on…

1 day ago

This website uses cookies