Categories: Technical analysis

Palladium Wave Analysis – 18 April, 2019

  • Palladium reversed from support area
  • Further gains are likely

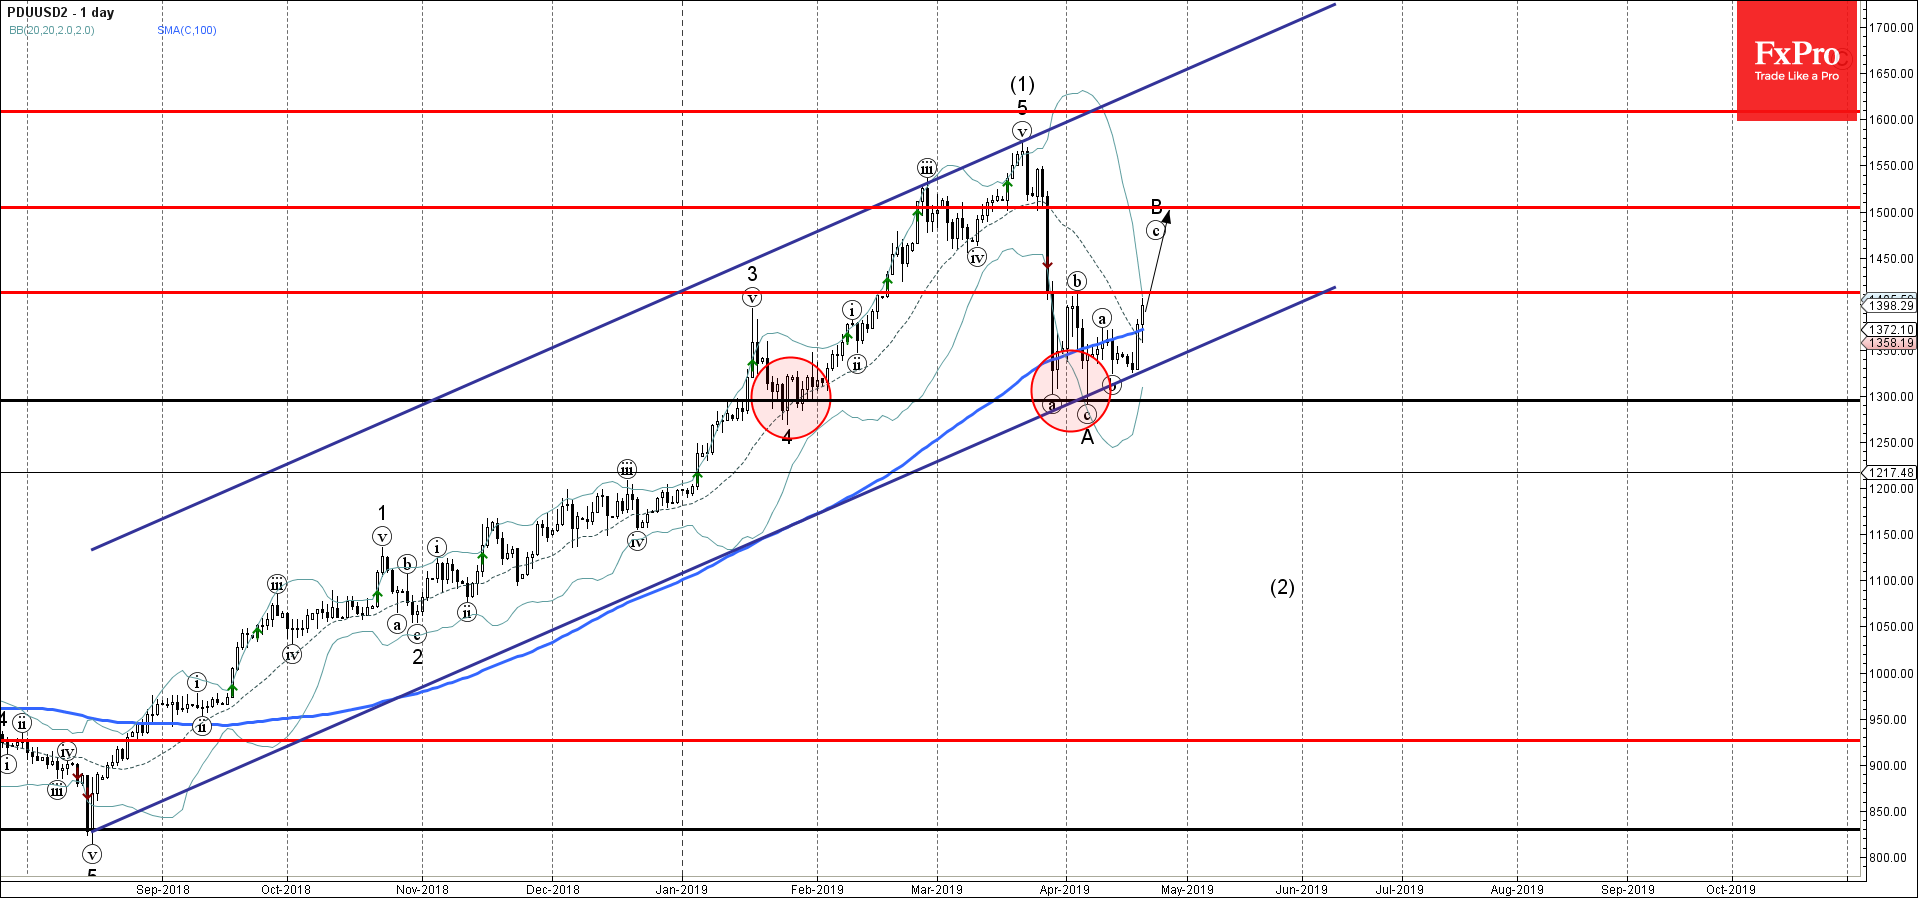
Palladium recently reversed up from the support area lying at the intersection of the round support level 1300.00 (which has been reversing the price from January) and the lower daily Bollinger Band.

The upward reversal from this support area created the daily Hammer which started the active short-term impulse wave B.

Palladium is expected to rise further and re-test the next round resistance level 1300.00 (target price for the completion of the active wave B).

AddThis Website Tools
The FxPro Tech Analysis Team

The FxPro technical experts prepare a daily analysis of the most active currency pairs (majors, crosses, exotics) and commodities. Selected instruments are reviewed on daily trends (D1, H4), using the active Elliott Wave setups, Japanese candlesticks, indicators, and support/resistance levels.

Share
Published by
The FxPro Tech Analysis Team
Tags: PDUUSD

Recent Posts

Tesla Wave Analysis – 21 March 2025

Tesla: ⬆️ Buy - Tesla reversed from support level 220.00 - Likely to rise to…

18 hours ago

Google Wave Analysis – 21 March 2025

Google: ⬆️ Buy - Google reversed from key support level 160.00 - Likely to rise…

18 hours ago

Silver Wave Analysis – 21 March 2025

Silver: ⬇️ Sell - Silver reversed from resistance level 34.00 - Likely to fall to…

19 hours ago

USDCHF Wave Analysis – 21 March 2025

USDCHF: ⬆️ Buy - USDCHF reversed from support level 0,8750 - Likely to fall to…

19 hours ago

What’s next: Flash PMIs, UK CPI & US PCE

The week ahead includes the release of the PMI business activity indexes for March, the…

1 day ago

Gold: Growth Opportunities

Gold has been in an uptrend, reaching record highs and offering growth opportunities. However, caution…

1 day ago