Categories: Technical analysis

Palladium Wave Analysis – 17 October 2025

Palladium: ⬇️ Sell

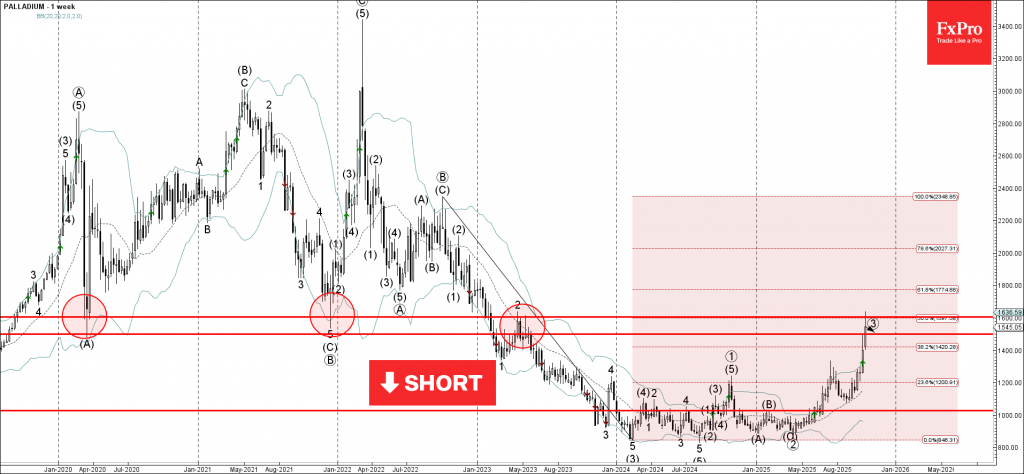
– Palladium reversed from long-term resistance level 1600.00

– Likely to fall to support level 1500.00

Palladium recently reversed down from the long-term resistance level 1600.00 (former strong support from 2020 and 2021, acting as resistance after it was broken at the start of 2023, as can be seen below).

The resistance level 1600.00 was strengthened by the upper weekly Bollinger Band and by the 50% Fibonacci correction of the weekly downtrend from the end of 2022.

Given the long-term downtrend, Palladium can be expected to fall to the next round support level 1500.00.

The FxPro Tech Analysis Team

The FxPro technical experts prepare a daily analysis of the most active currency pairs (majors, crosses, exotics) and commodities. Selected instruments are reviewed on daily trends (D1, H4), using the active Elliott Wave setups, Japanese candlesticks, indicators, and support/resistance levels.

Share
Published by
The FxPro Tech Analysis Team
Tags: Palladium

Recent Posts

NZDCAD Wave Analysis – 7 January 2026

NZDCAD: ⬆️ Buy - NZDCAD reversed from support zone - Likely to rise to resistance…

6 hours ago

Bitcoin Wave Analysis – 7 January 2026

Bitcoin: ⬇️ Sell - Bitcoin reversed from resistance zone - Likely to fall to support…

6 hours ago

EURGBP Wave Analysis – 7 January 2026

EURGBP: ⬆️ Buy - EURGBP reversed from support zone - Likely to rise to resistance…

6 hours ago

Brent Crude Oil Wave Analysis – 7 January 2026

Brent Crude Oil: ⬇️ Sell - Brent Crude Oil reversed from resistance zone - Likely…

6 hours ago

Old fears about the euro have returned

The resurgence of the political crisis in France is weighing on EURUSD The US dollar…

15 hours ago

The crypto market has hit the upper limit of its rebound

The crypto market faces resistance at $3.2T; sentiment rises, but selling pressure persists. Bitcoin and…

17 hours ago

This website uses cookies