Categories: Technical analysis

Palladium Wave Analysis – 15 November , 2018

  • Palladium approached resistance area
  • Downward correction is likely

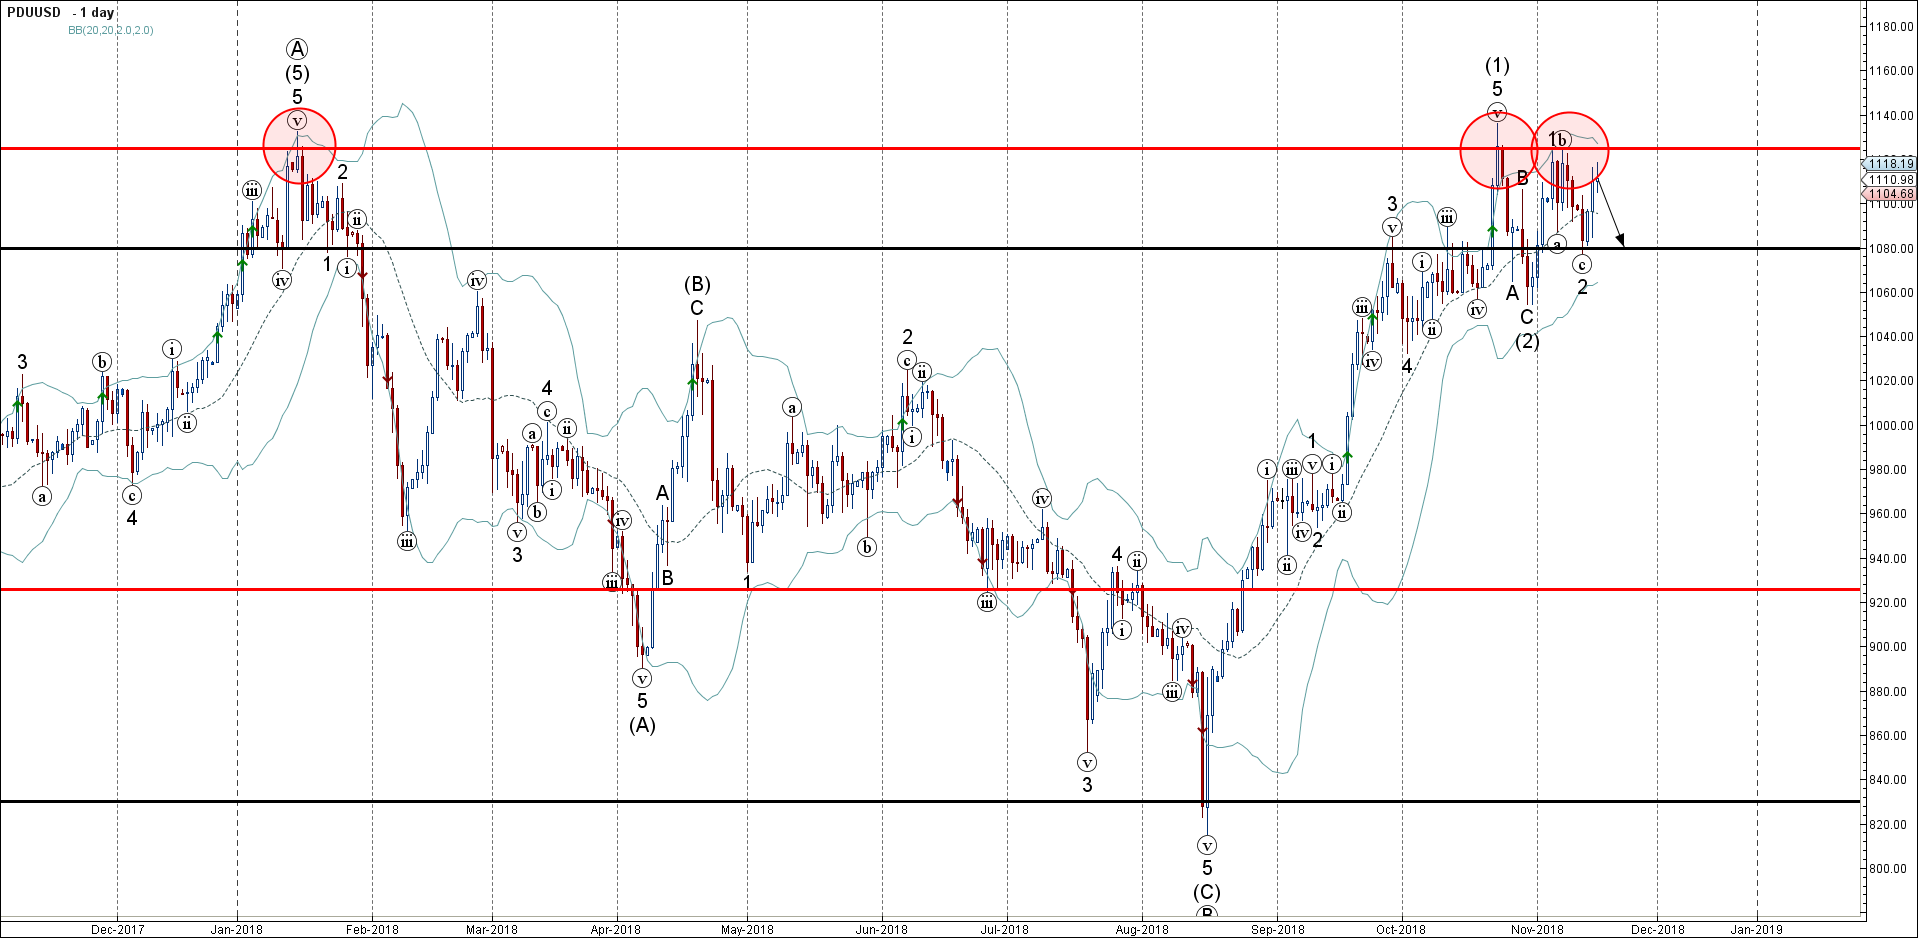
Palladium is currently trading close to the strong resistance area lying between the major, long-term resistance level 0.6750 (which stopped the previous sharp up trends in January and October) and the upper daily Bollinger Band.

The active impulse wave 3 belongs to the medium-term impulse wave (3) from the end of last month.

Given the strength of the aforementioned resistance area, Palladium is expected to correct down from the current levels and re-test the next support level 1080.00 (low of the previous short-term correction 2).

AddThis Website Tools
The FxPro Tech Analysis Team

The FxPro technical experts prepare a daily analysis of the most active currency pairs (majors, crosses, exotics) and commodities. Selected instruments are reviewed on daily trends (D1, H4), using the active Elliott Wave setups, Japanese candlesticks, indicators, and support/resistance levels.

Share
Published by
The FxPro Tech Analysis Team
Tags: PDUUSD

Recent Posts

Adobe Wave Analysis – 13 March 2025

Adobe: ⬇️ Sell - Adobe broke round support level 400.00 - Likely to fall to…

11 hours ago

Apple Wave Analysis – 13 March 2025

Apple: ⬇️ Sell - Apple broke support area - Likely to fall to support level…

11 hours ago

Gold Wave Analysis – 13 March 2025

Gold: ⬆️ Buy - Gold broke resistance level 2962.00 - Likely to rise to resistance…

13 hours ago

EURGBP Wave Analysis – 13 March 2025

EURGBP: ⬇️ Sell - EURGBP reversed from key resistance level 0.8450 - Likely to fall…

13 hours ago

Gold climbs on lower rate speculations

The gold price has resumed updating its all-time highs on the back of speculations around…

18 hours ago

Crypto: just a bumpy downtrend

The crypto market experienced a drop, but towards the end of the week, there was…

19 hours ago