Categories: Technical analysis

Palladium Wave Analysis – 13 September, 2022

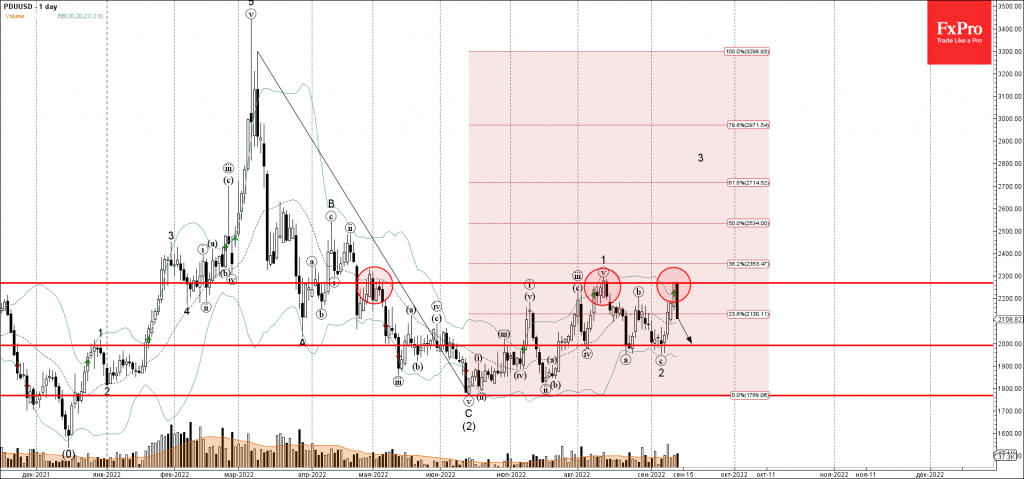
• Palladium reversed from resistance level 2270.00

• Likely to fall to support level 2000.00

Palladium recently reversed down from the key resistance level 2270.00 (which has been reversing the price from the end of April).

The resistance level 2270.00 was further strengthened by the nearby upper daily Bollinger Band and by the 38.2% Fibonacci correction of the ABC correction (2) from March.

Palladium can be expected to fall further toward the next round support level 2000.00 (which stopped the previous waves (iv), (a) and 2).

The FxPro Tech Analysis Team

The FxPro technical experts prepare a daily analysis of the most active currency pairs (majors, crosses, exotics) and commodities. Selected instruments are reviewed on daily trends (D1, H4), using the active Elliott Wave setups, Japanese candlesticks, indicators, and support/resistance levels.

Share
Published by
The FxPro Tech Analysis Team
Tags: Palladium

Recent Posts

AUDUSD Wave Analysis – 14 April 2025

AUDUSD ⬆️ Buy - AUDUSD reversed from the long-term support level 0.5945 - Likely to rise to…

27 minutes ago

EURCHF Wave Analysis – 14 April 2025

EURCHF ⬆️ Buy - EURCHF reversed from support zone - Likely to rise to resistance level 0.9365…

27 minutes ago

Baidu Wave Analysis – 11 April 2025

Baidu: ⬆️ Buy - Baidu reversed from support zone - Likely to rise to resistance level…

3 days ago

USDCAD Wave Analysis – 11 April 2025

USDCAD: ⬇️ Sell - USDCAD broke support zone - Likely to fall to support level…

3 days ago

Video: Massive Market Reversal or Total Collapse? The Charts Are Screaming…

We break down one of the most dramatic weeks in the markets — including a…

3 days ago

US Dollar Suffers Amidst Inflation Data and Expectations

The US dollar is suffering due to weaker than expected inflation data and a surge…

3 days ago

This website uses cookies