Categories: Technical analysis

Palladium Wave Analysis – 12 March, 2020

  • Palladium under bearish pressure
  • Likely to fall to 1900.00


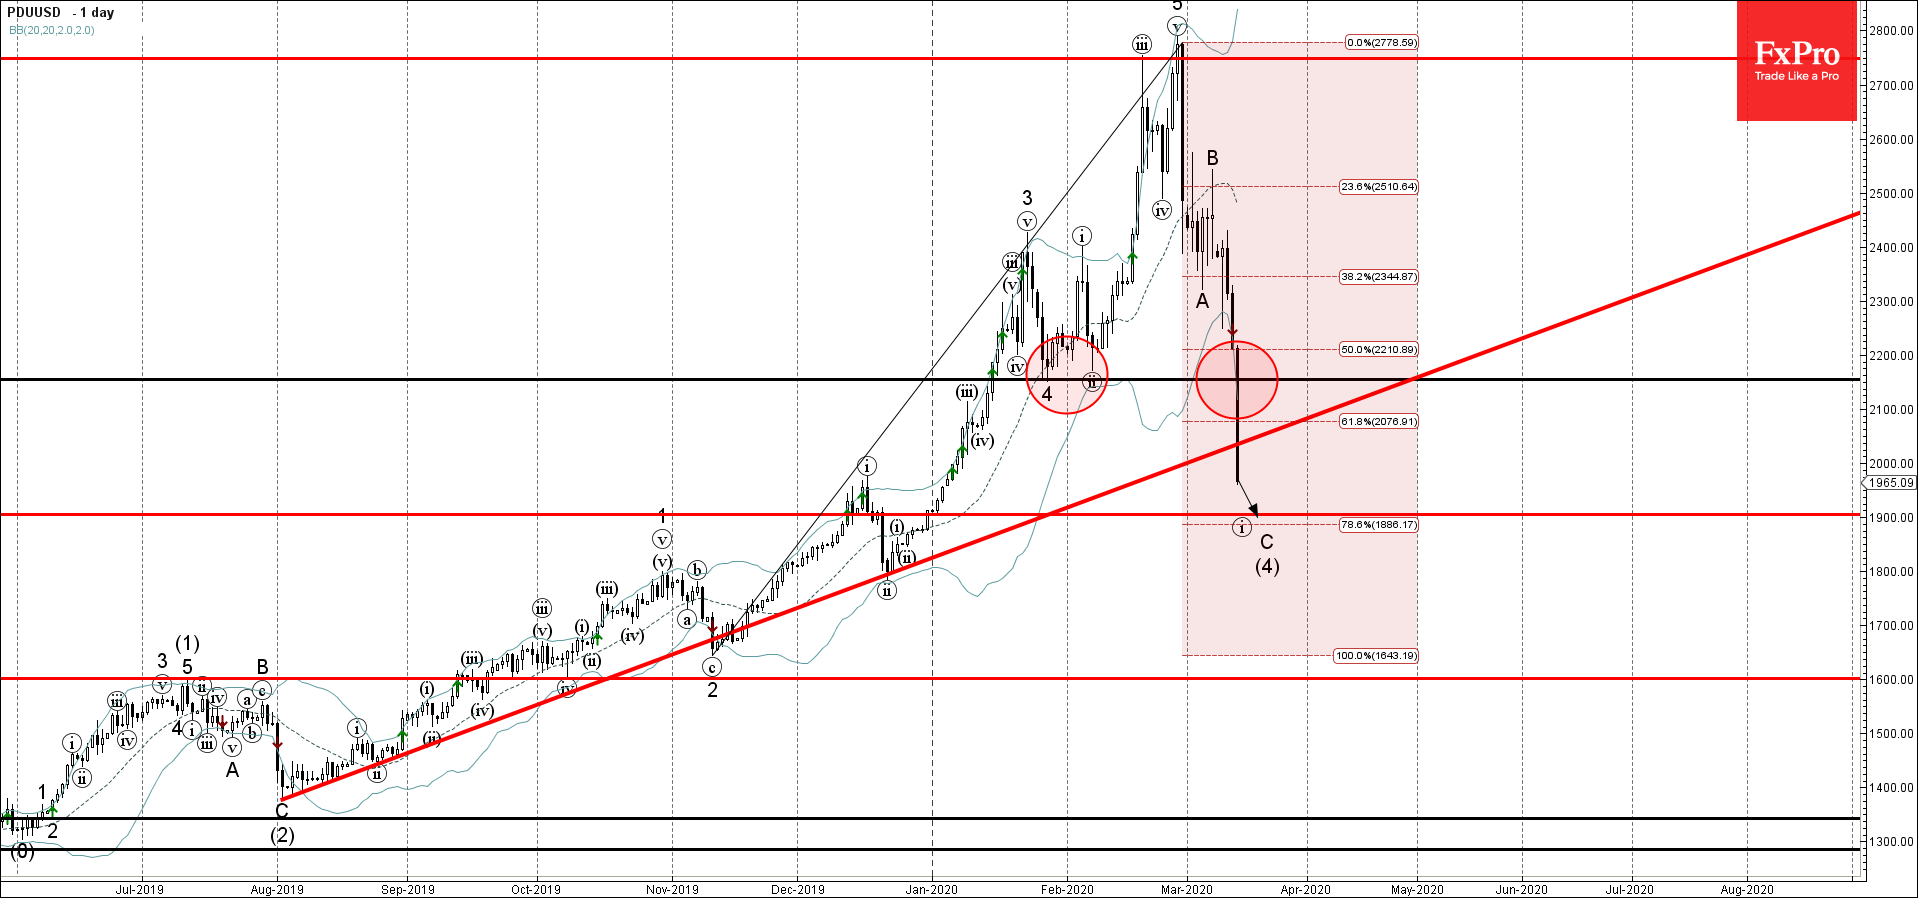
Palladium under bearish pressure after the earlier breakout of the support area lying between the support level 2155.00 (low of waves 4 and (ii)), support trendline from last August and the 61.8% Fibonacci correction of the previous upward impulse from November.

The breakout of the aforementioned support zone accelerated the active waves C and (4).

Palladium is likely to fall further toward the next round support level 1900.00 (likely price for the completion of the active impulse wave C)


The FxPro Tech Analysis Team

The FxPro technical experts prepare a daily analysis of the most active currency pairs (majors, crosses, exotics) and commodities. Selected instruments are reviewed on daily trends (D1, H4), using the active Elliott Wave setups, Japanese candlesticks, indicators, and support/resistance levels.

Share
Published by
The FxPro Tech Analysis Team
Tags: PDUUSD

Recent Posts

Brent crude oil Wave Analysis 17 May 2024

- Brent crude oil reversed from key support level 81.00 - Likely to test resistance…

1 day ago

Silver Wave Analysis 17 May 2024

- Silver broke multi-year resistance level 29.50 - Likely to reach resistance level 32.00 Silver…

1 day ago

The dollar index clings to the uptrend

The US dollar is not giving up without a fight, gaining for the second day…

1 day ago

After surpassing $30, silver may aim for $50

Silver climbed above $29.8, rewriting the highs from January 2021, but once again faced selling…

1 day ago

The crypto market is ready to grow further

Market picture The crypto market cooled off on Thursday afternoon, but on Friday morning, buyers…

1 day ago

Amazon Wave Analysis 16 May 2024

- Amazon reversed from resistance level 190.00 - Likely to fall to support level 180.00…

2 days ago

This website uses cookies