Categories: Technical analysis

Palladium Wave Analysis – 11 December , 2018

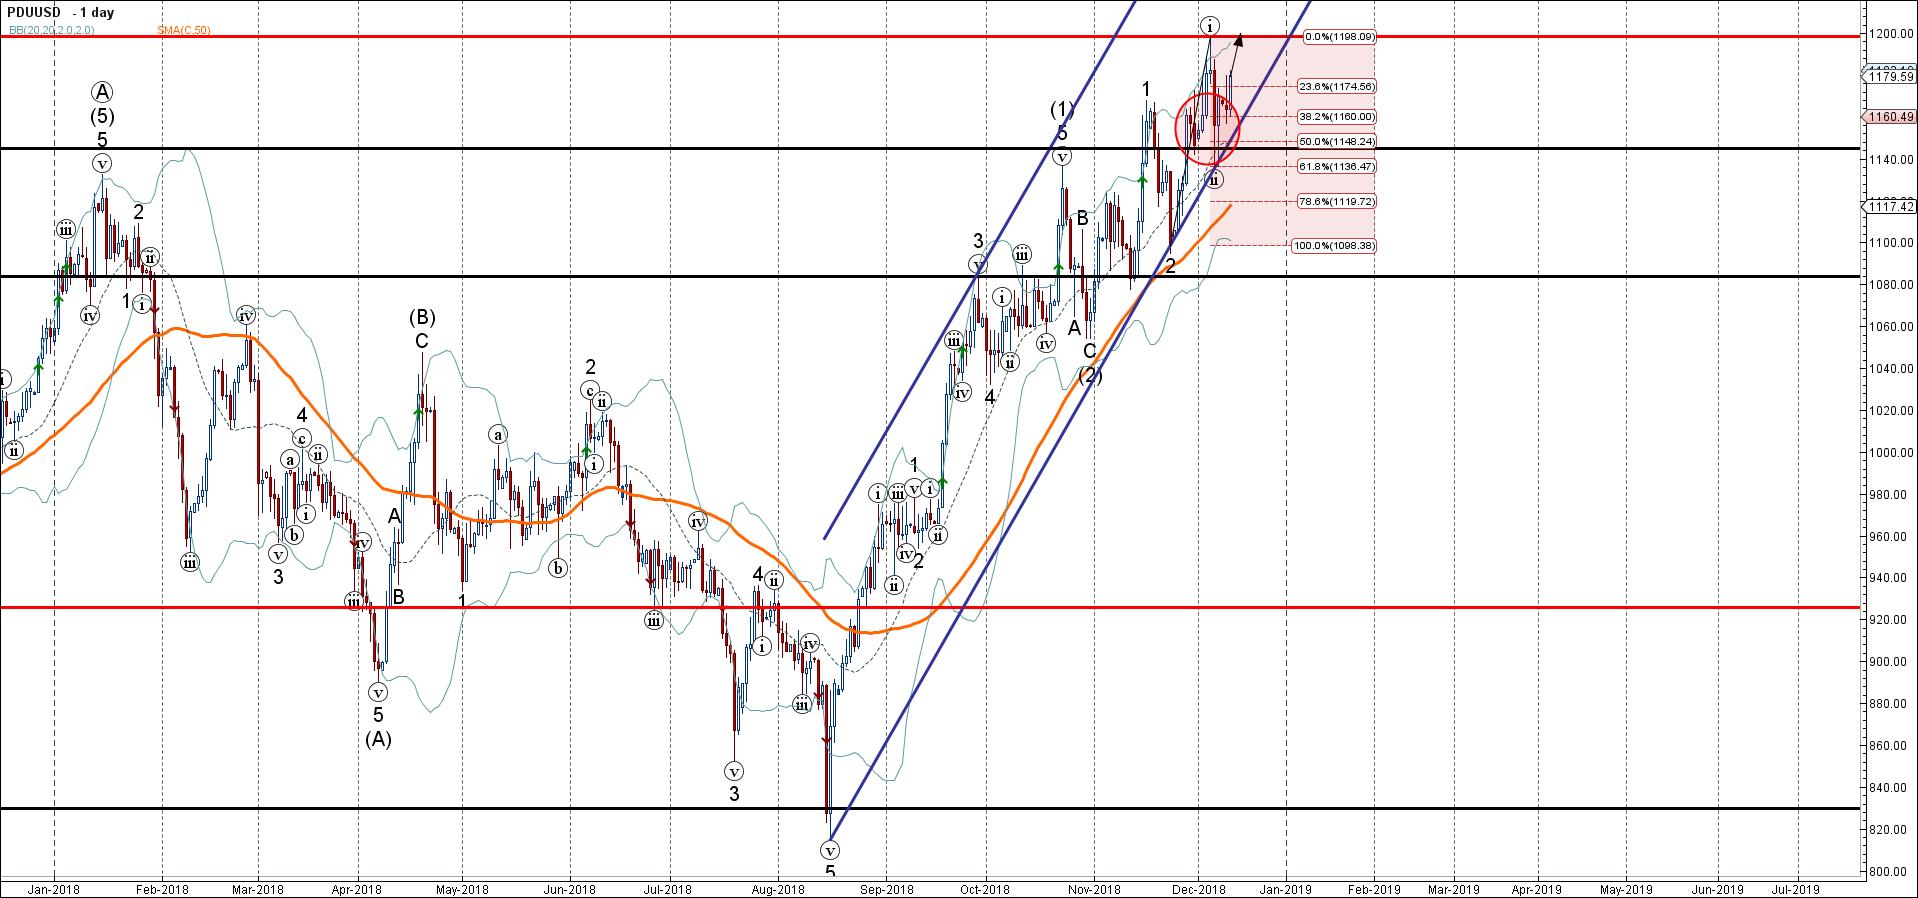
  • Palladium reversed from support level 1140.00
  • Further gains are likely

Palladium recently reversed up from the support level 1140.00 – strengthened by the support trendline of the daily up channel from August and by the 50% Fibonacci correction of the previous impulse wave (i).

The upward reversal from the support level 1140.00 started the active short–term impulse wave (iii) – which is a part of the medium-term impulse wave (3) from the end of October.

Palladium is expected to rise further and re-test the next round resistance level 1200.00 (which reversed the previous impulse wave (i)).

The FxPro Tech Analysis Team

The FxPro technical experts prepare a daily analysis of the most active currency pairs (majors, crosses, exotics) and commodities. Selected instruments are reviewed on daily trends (D1, H4), using the active Elliott Wave setups, Japanese candlesticks, indicators, and support/resistance levels.

Share
Published by
The FxPro Tech Analysis Team
Tags: PDUUSD

Recent Posts

German industrial production slide brings closer ECB’s rate cut  

German industrial production continues to decline. The rate of contraction in March was slightly better…

38 mins ago

US indices are heading towards highs

US indices have been gaining daily since the beginning of May. They have found strength…

2 hours ago

Persisting pressure on crypto

Market picture  The crypto market has lost 2% of its capitalisation over the last 24…

6 hours ago

S&P 500 Wave Analysis 7 May 2024

- S&P 500 reversed from support level 5000.00 - Likely to rise to resistance level…

20 hours ago

USDCHF Wave Analysis 7 May 2024

- USDCHF reversed from support zone - Likely to rise to resistance level 0.9200 USDCHF…

20 hours ago

EURUSD at the equilibrium, where will it go next?

The single currency is trading near $1.076, waiting for further cues and facing serious resistance…

1 day ago

This website uses cookies