Categories: Technical analysis

Palladium Wave Analysis – 04 October , 2018

• Palladium reversed from support area • Further gains are likely

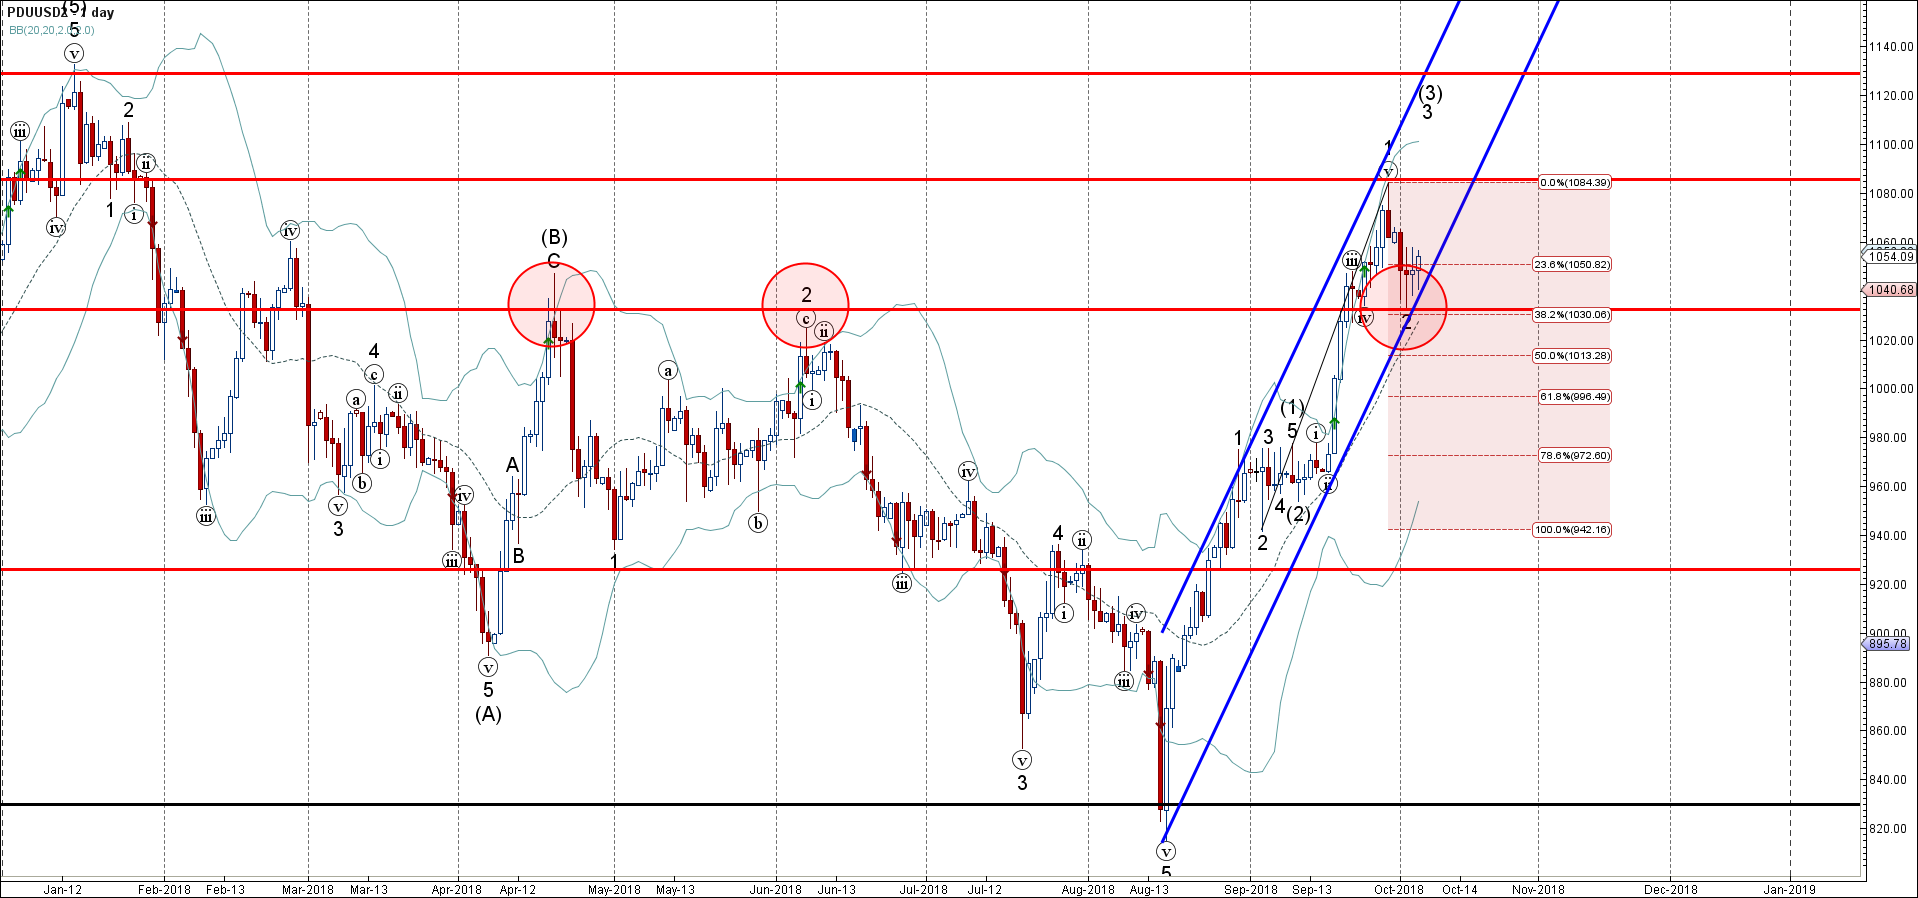
Palladium recently reversed up from the support zone located between the support level 1030.00, support trendline of the narrow daily up channel from August and the 38.2% Fibonacci correction of the upward impulse from September.

The upward reversal from this support started the active short-term impulse wave 3– which is a part of the medium-term impulse wave (3) from September.

Palladium is expected to rise further and re-test the next resistance level 1080.00 (top of the previous impulse wave 1 from last month).

AddThis Website Tools
The FxPro Tech Analysis Team

The FxPro technical experts prepare a daily analysis of the most active currency pairs (majors, crosses, exotics) and commodities. Selected instruments are reviewed on daily trends (D1, H4), using the active Elliott Wave setups, Japanese candlesticks, indicators, and support/resistance levels.

Share
Published by
The FxPro Tech Analysis Team
Tags: PDUUSD

Recent Posts

AMD Wave Analysis – 28 March 2025

AMD: ⬇️ Sell - AMD reversed from pivotal resistance level 115.00 - Likely to fall…

2 days ago

Google Wave Analysis – 28 March 2025

Google: ⬇️ Sell - Google broke key support level 160.00 - Likely to fall to…

2 days ago

Gold Wave Analysis – 28 March 2025

Gold: ⬆️ Buy - Gold broke resistance level 3050.00 - Likely to rise to resistance…

2 days ago

Ethereum Wave Analysis – 28 March 2025

Ethereum: ⬇️ Sell - Ethereum reversed from the resistance level 2120.00 - Likely to fall…

2 days ago

US inflation accelerates but lags income growth

US PCE inflation exceeded expectations at 2.8% in February. Income growth and savings rates remain…

2 days ago

What is next: Australia Rate, EU CPI, US NFP

Europe will switch to daylight saving time next week. Key events include the RBA's rate…

2 days ago