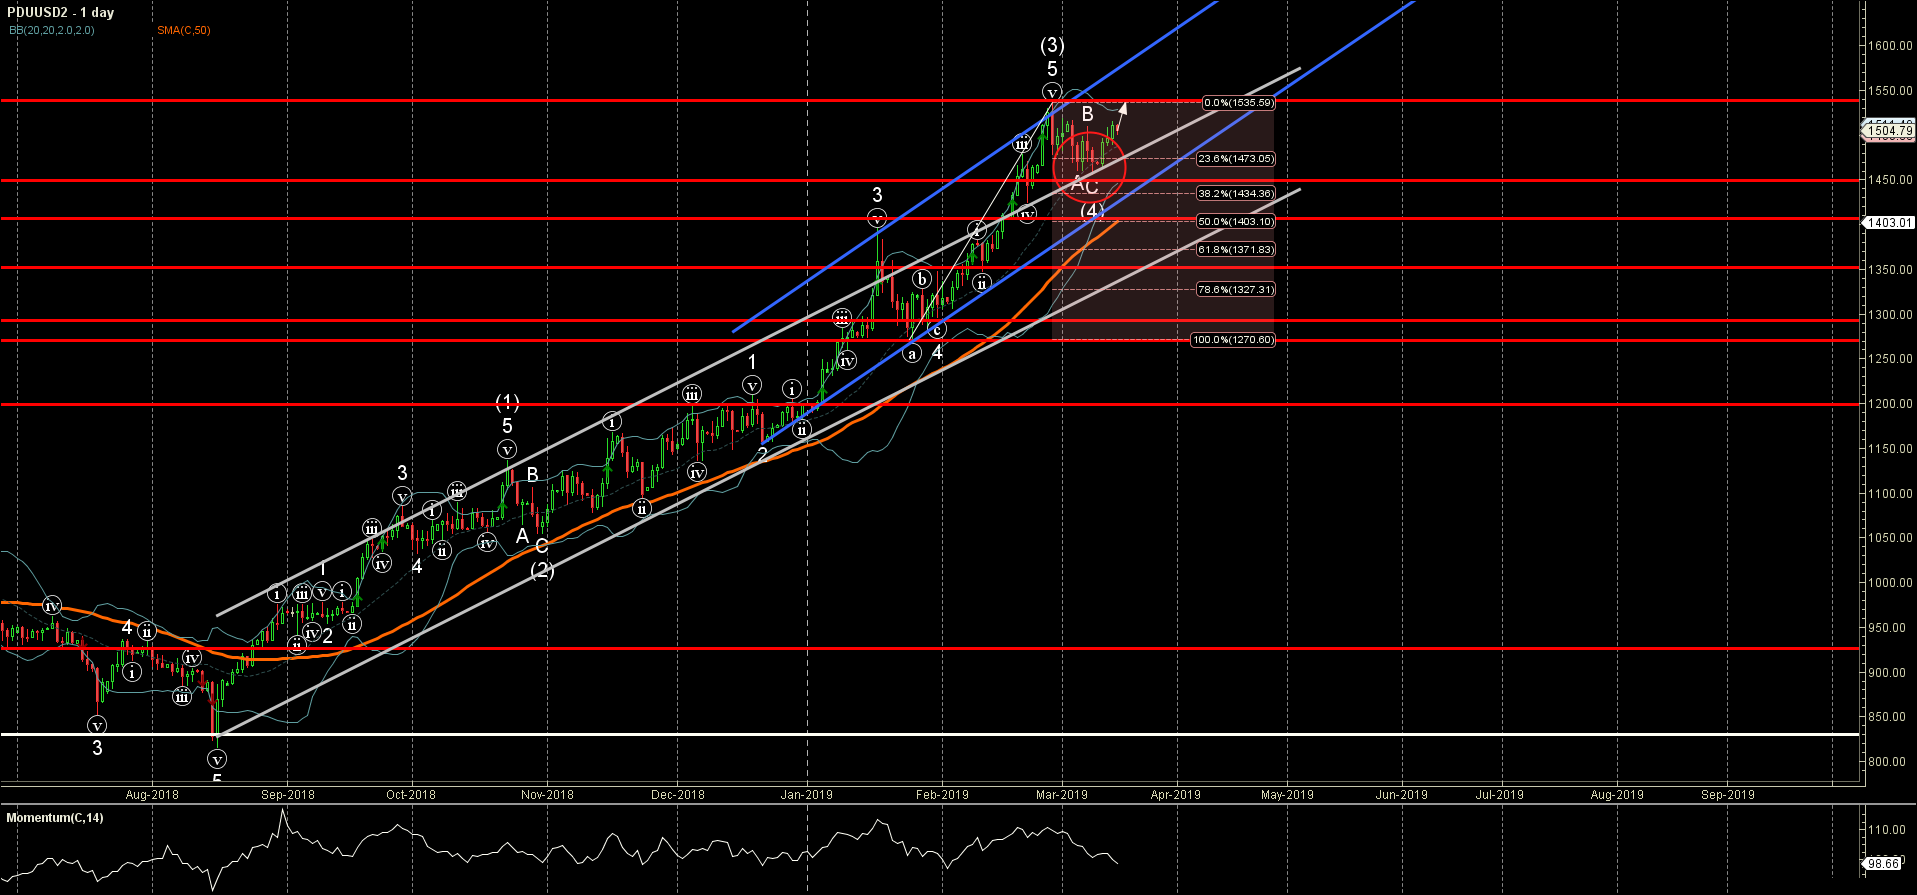
- Palladium reversed from key support area
- Further gains are likely
Palladium recently reversed up from the key support area lying near the support level 1450.00 and the upper trendline of the recently broken extended up channel from August.
This support area was further strengthened by the lower daily Bollinger Band and by the 38.2% Fibonacci correction of the previous upward impulse from January.
Palladium is expected to rise further in the active impulse wave (5) and re-test the next resistance level 1530.00 (top of the previous impulse wave (3))