Categories: Technical analysis

NZDUSD Wave Analysis – 8 June, 2020

• NZDUSD broke resistance area

• Likely to rise to 0.6640

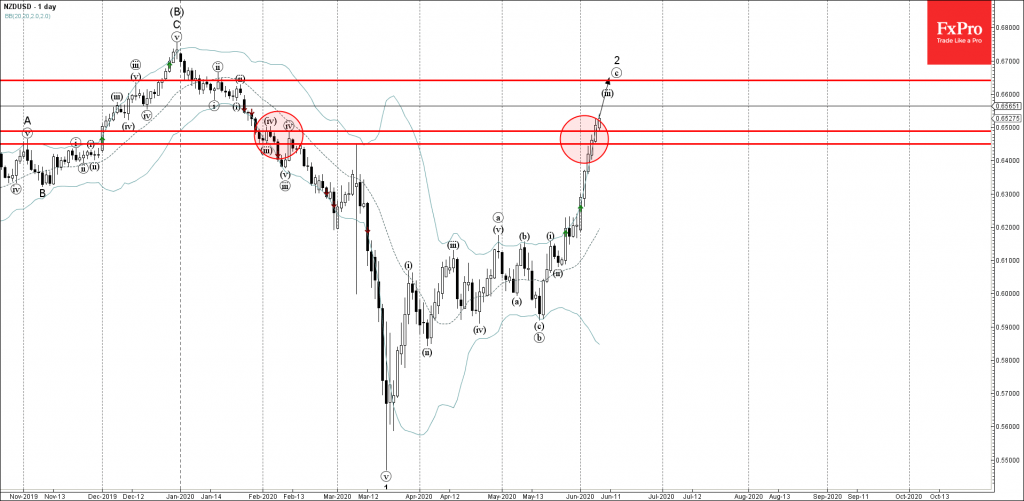
NZDUSD recently broke the resistance area lying between the resistance levels 0.6450 (monthly high from March) and 0.6490 (monthly high from February).

The breakout of this resistance area accelerated the active short-term impulse sequence (c) from the middle of May.

NZDUSD is likely to rise further toward the next resistance level 0.6640 (target price for the completion of the active impulse wave (c)).

AddThis Website Tools
The FxPro Tech Analysis Team

The FxPro technical experts prepare a daily analysis of the most active currency pairs (majors, crosses, exotics) and commodities. Selected instruments are reviewed on daily trends (D1, H4), using the active Elliott Wave setups, Japanese candlesticks, indicators, and support/resistance levels.

Share
Published by
The FxPro Tech Analysis Team
Tags: NZDUSD

Recent Posts

Tariff news and resistance zone put pressure on crypto

The crypto market capitalisation decreased by 2.6% in 24 hours due to the announcement of…

27 minutes ago

Gold Wave Analysis – 16 April 2025

Gold: ⬆️ Buy - Gold broke resistance zone - Likely to rise to the resistance…

4 hours ago

GBPUSD Wave Analysis – 16 April 2025

GBPUSD: ⬆️ Buy - GBPUSD broke key resistance level 1.3200 - Likely to rise to…

4 hours ago

Platinum Wave Analysis – 15 April 2025

Platinum: ⬆️ Buy - Platinum reversed from support level 905.00 - Likely to rise to…

14 hours ago

USDJPY Wave Analysis – 15 April 2025

USDJPY: ⬆️ Buy - USDJPY reversed from long-term support level 142.00 - Likely to rise…

14 hours ago

FTSE 100 Wave Analysis – 15 April 2025

FTSE 100: ⬆️ Buy - FTSE 100 index broke the resistance zone - Likely to rise…

16 hours ago