Categories: Technical analysis

NZDUSD Wave Analysis – 7 July 2025

NZDUSD: ⬇️ Sell

– NZDUSD reversed from resistance level 0.6100

– Likely to fall to support level 0.5950

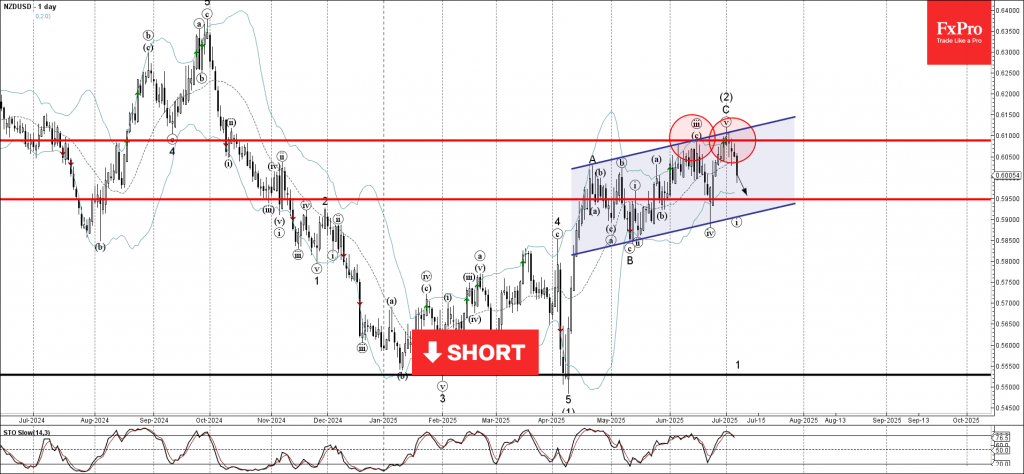
NZDUSD currency pair recently reversed down from the key resistance level 0.6100 (which has been steadily reversing the price from October, as can be seen from the daily NZDUSD chart below) – intersecting with the upper daily Bollinger Band and the resistance trendline of the daily up channel from April.

The downward reversal from the resistance level 0.6100 stopped the previous medium-term impulse ABC correction (2) from the start of April.

Given the strength of the resistance level 0.6100, NZDUSD currency pair can be expected to fall to the next support level 0.5950.

The FxPro Tech Analysis Team

The FxPro technical experts prepare a daily analysis of the most active currency pairs (majors, crosses, exotics) and commodities. Selected instruments are reviewed on daily trends (D1, H4), using the active Elliott Wave setups, Japanese candlesticks, indicators, and support/resistance levels.

Share
Published by
The FxPro Tech Analysis Team
Tags: NZDUSD

Recent Posts

Geopolitics will destroy the euro

•    EURUSD falls due to geopolitics and expectations of tariff removal •    Gold returns to…

5 hours ago

Platinum Wave Analysis – 8 January 2026

Platinum: ⬇️ Sell - Platinum reversed from pivotal resistance level 150.00 - Likely to fall to…

18 hours ago

Baidu Wave Analysis – 8 January 2026

Baidu: ⬇️ Sell - Baidu reversed from resistance zone - Likely to fall to support level…

18 hours ago

EURUSD Wave Analysis – 8 January 2026

EURUSD: ⬇️ Sell - EURUSD broke daily up channel - Likely to fall to support…

20 hours ago

WTI crude oil Wave Analysis – 8 January 2026

WTI crude oil: ⬆️ Buy - WTI crude oil reversed from support zone - Likely…

20 hours ago

Do not underestimate dollar

Positive macro statistics for the US are helping the greenback. Gold could rise to $4,610…

1 day ago

This website uses cookies