Categories: Technical analysis

NZDUSD Wave Analysis – 3 January, 2022

• NZDUSD reversed from pivotal resistance level 0.6840

• Likely to test support level 0.6700

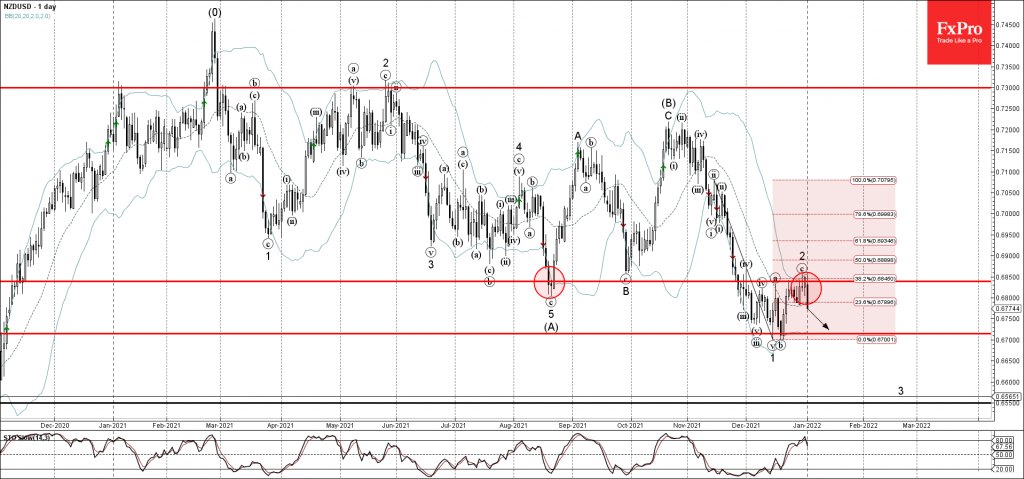
NZDUSD currency pair recently reversed down from the pivotal resistance level 0.6840 (former strong support from August) intersecting with the upper Bollinger Band and the 38.2% Fibonacci correction of the downward price impulse from November.

The resistance zone near the resistance level 0.6840 was strengthened by the upper Bollinger Band and by the 38.2% Fibonacci correction of the downward price impulse from November.

NZDUSD currency pair can be expected to fall further toward the next support level 0.6700 (which reversed the waves 1 and (b) in December).

The FxPro Tech Analysis Team

The FxPro technical experts prepare a daily analysis of the most active currency pairs (majors, crosses, exotics) and commodities. Selected instruments are reviewed on daily trends (D1, H4), using the active Elliott Wave setups, Japanese candlesticks, indicators, and support/resistance levels.

Share
Published by
The FxPro Tech Analysis Team
Tags: NZDUSD

Recent Posts

Geopolitics will destroy the euro

•    EURUSD falls due to geopolitics and expectations of tariff removal •    Gold returns to…

7 hours ago

Platinum Wave Analysis – 8 January 2026

Platinum: ⬇️ Sell - Platinum reversed from pivotal resistance level 150.00 - Likely to fall to…

20 hours ago

Baidu Wave Analysis – 8 January 2026

Baidu: ⬇️ Sell - Baidu reversed from resistance zone - Likely to fall to support level…

20 hours ago

EURUSD Wave Analysis – 8 January 2026

EURUSD: ⬇️ Sell - EURUSD broke daily up channel - Likely to fall to support…

21 hours ago

WTI crude oil Wave Analysis – 8 January 2026

WTI crude oil: ⬆️ Buy - WTI crude oil reversed from support zone - Likely…

21 hours ago

Do not underestimate dollar

Positive macro statistics for the US are helping the greenback. Gold could rise to $4,610…

1 day ago

This website uses cookies