Categories: Technical analysis

NZDUSD Wave Analysis 29 September, 2020

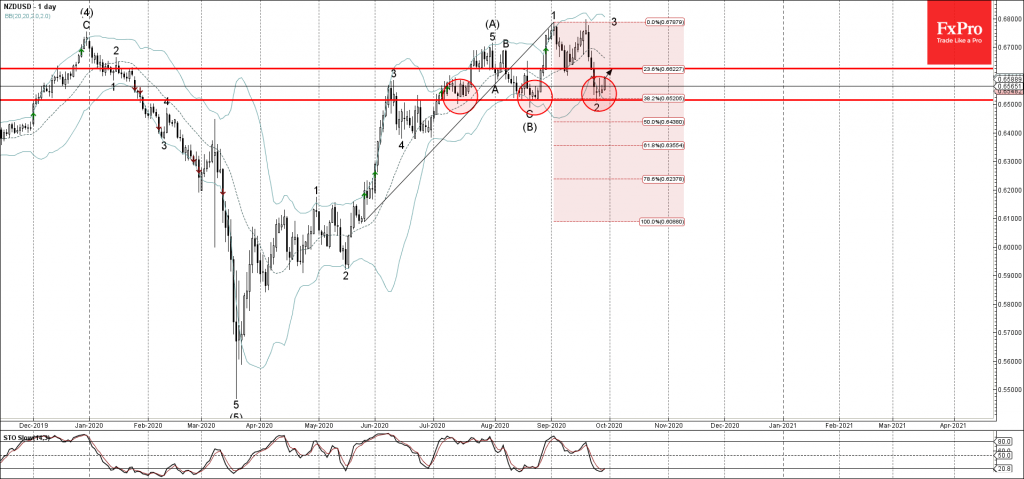
• NZDUSD reversed from key support level 0.6500

• Likely to rise to 0.6625

NZDUSD recently reversed up from the key support level 0.6500 (which has been steadily reversing the price from July), lower daily Bollinger Band and the 38.2% Fibonacci correction of the upward impulse from the middle of May.

The upward reversal from the support level 0.6500 started the active short-term impulse wave 3.

Given the oversold daily Stochastic – NZDUSD is likely to rise to the next resistance level at 0.6625 (former support from the start of September).

The FxPro Tech Analysis Team

The FxPro technical experts prepare a daily analysis of the most active currency pairs (majors, crosses, exotics) and commodities. Selected instruments are reviewed on daily trends (D1, H4), using the active Elliott Wave setups, Japanese candlesticks, indicators, and support/resistance levels.

Share
Published by
The FxPro Tech Analysis Team
Tags: NZDUSD

Recent Posts

The crypto market is updating its lows but avoiding sharp changes

Market Picture The crypto market set another trap for bulls yesterday afternoon, jumping to $3T…

27 minutes ago

JPMorgan Chase Wave Analysis – 18 December 2025

JPMorgan Chase: ⬇️ Sell - JPMorgan Chase reversed from resistance area - Likely to fall…

11 hours ago

EURUSD Wave Analysis – 18 December 2025

EURUSD: ⬇️ Sell - EURUSD reversed from resistance area - Likely to fall to support level…

11 hours ago

AUDJPY Wave Analysis – 18 December 2025

AUDJPY: ⬆️ Buy - AUDJPY reversed from support area - Likely to rise to resistance…

12 hours ago

Palladium Wave Analysis – 18 December 2025

Palladium: ⬆️ Buy - Palladium broke multi-month resistance level 1600.00 - Likely to rise to resistance…

12 hours ago

GBPUSD. Current situation #tradelikeapro #trading #tradingstrategy #tradingshorts #gbpusd #gbp

Today is Thursday, the 18th of December, and we'll be talking about the British pound…

17 hours ago

This website uses cookies