Categories: Technical analysis

NZDUSD Wave Analysis 28 January, 2021

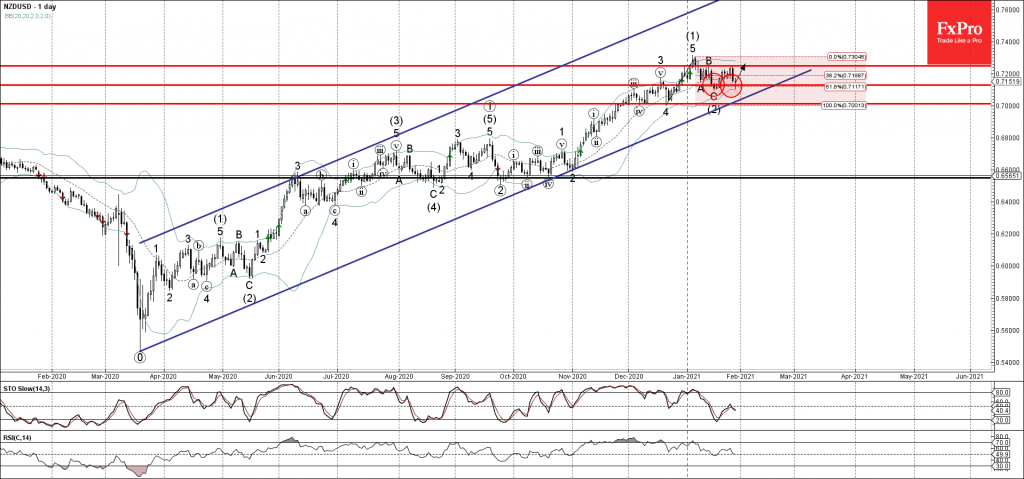
• NZDUSD reversed from support level 0.7100  

• Likely to rise to 0.7250

NZDUSD today reversed up from the key support level 0.7100 (which also stopped the previous ABC correction (2)) – intersecting with the lower daily Bollinger Band.

If the pair closes today near the current levels it will form the daily candlesticks reversal pattern Hammer – strong buy signal for NZDUSD.

Given the clear daily uptrend  – NZDUSD is expected to rise further toward the next resistance level 0.7250 (top of the previous corrective wave B).

The FxPro Tech Analysis Team

The FxPro technical experts prepare a daily analysis of the most active currency pairs (majors, crosses, exotics) and commodities. Selected instruments are reviewed on daily trends (D1, H4), using the active Elliott Wave setups, Japanese candlesticks, indicators, and support/resistance levels.

Share
Published by
The FxPro Tech Analysis Team
Tags: NZDUSD

Recent Posts

USDJPY Wave Analysis 26 April 2024

- USDJPY broke key resistance level 155.00 - Likely to rise to resistance level 160.00…

2 days ago

Ebay Wave Analysis 26 April 2024

- Ebay reversed from support level 49.35 - Likely to rise to resistance level 52.55…

2 days ago

False Alert with Yen Interventions?

Even though the Bank of Japan left the key rate and parameters of the QE…

2 days ago

Cooler Bitcoin

Market picture  Market Dynamics: The cryptocurrency market stabilised, losing just 0.1% of capitalisation and dropping to…

2 days ago

GBPCAD Wave Analysis 25 April 2024

- GBPCAD reversed from key support level 1.6910 - Likely to rise to resistance level…

3 days ago

GBPAUD Wave Analysis 25 April 2024

- GBPAUD reversed from support level 1.9135 - Likely to rise to resistance level 1.9360…

3 days ago

This website uses cookies