Categories: Technical analysis

NZDUSD Wave Analysis – 26 May, 2020

• NZDUSD broke resistance level 0.6145

• Likely to rise to 0.6300

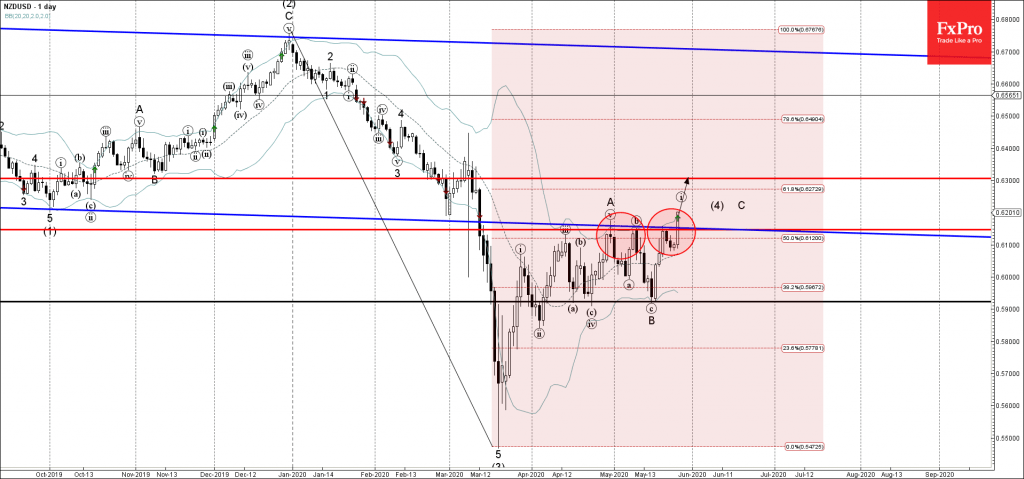
NZDUSD recently broke through the resistance level 0.6145 (which stopped the previous waves A and (b)) intersecting with the lower trendline of the wide down channel from the start of 2019.

The breakout of the resistance level 0.6145 also coincided with the breakout of the 50% Fibonacci correction of the previous downward impulse wave (3) from December.

NZDUSD is likely to rise further in the active impulse wave C toward the next resistance level 0.6300.

The FxPro Tech Analysis Team

The FxPro technical experts prepare a daily analysis of the most active currency pairs (majors, crosses, exotics) and commodities. Selected instruments are reviewed on daily trends (D1, H4), using the active Elliott Wave setups, Japanese candlesticks, indicators, and support/resistance levels.

Share
Published by
The FxPro Tech Analysis Team
Tags: NZDUSD

Recent Posts

AUDJPY Wave Analysis – 5 December 2025

AUDJPY: ⬆️ Buy - AUDJPY broke long-term resistance level 102.30 - Likely to rise to…

2 hours ago

Aptos Wave Analysis – 5 December 2025

Aptos: ⬇️ Sell - Aptos testing major support at 1.688 - Likely to fall to…

2 hours ago

Pro News Weekly: Market Shake-Up, Dollar Drops, Gold Surges, Bitcoin Wobbles!

Welcome to Pro News Flash! 💵 The U.S. dollar slips 🏆 Major stock indices struggle…

8 hours ago

Solana Wave Analysis – 5 December 2025

Solana: ⬇️ Sell - Solana reversed from resistance zone - Likely to fall to support…

9 hours ago

EURAUD Wave Analysis – 5 December 2025

EURAUD : ⬇️ Sell - EURAUD broke the support level 1.7600 - Likely to fall…

9 hours ago

Forex has set its priorities

In 2026, experts favour the yen, see modest euro growth, and expect pressure on the…

13 hours ago

This website uses cookies