Categories: Technical analysis

NZDUSD Wave Analysis – 26 December, 2019

  • NZDUSD broke key resistance level 0.6630
  • Likely to rise to 0.6700

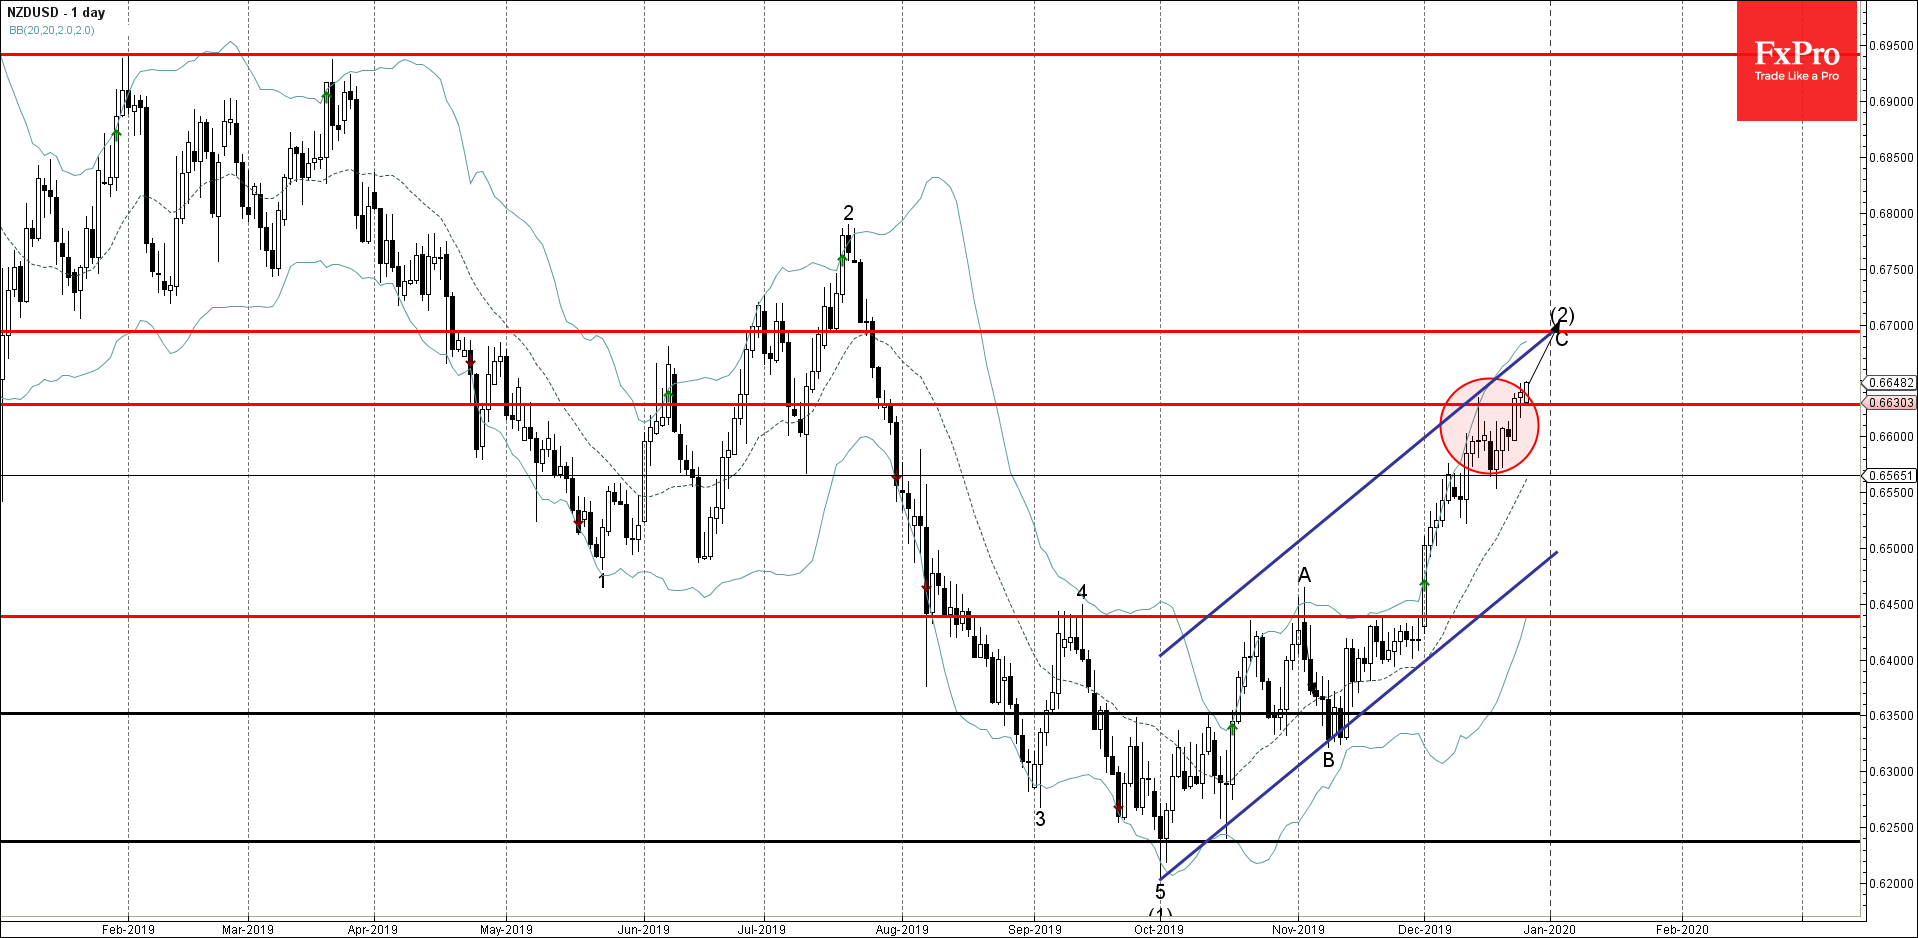
NZDUSD recently broke above the key resistance level 0.6630 (which created the pervious daily Japanese candlesticks reversal pattern Shooting Star at the start of December).

The breakout of the resistance level 0.6630 accelerated the active short-term impulse wave C – which belongs to the ABC correction (2) from October.

NZDUSD is expected to rise further toward the next resistance level 0.6700 (target for the completion of the active impulse wave C, intersecting with the daily up channel from October).

The FxPro Tech Analysis Team

The FxPro technical experts prepare a daily analysis of the most active currency pairs (majors, crosses, exotics) and commodities. Selected instruments are reviewed on daily trends (D1, H4), using the active Elliott Wave setups, Japanese candlesticks, indicators, and support/resistance levels.

Share
Published by
The FxPro Tech Analysis Team
Tags: NZDUSD

Recent Posts

USDJPY Wave Analysis 26 April 2024

- USDJPY broke key resistance level 155.00 - Likely to rise to resistance level 160.00…

2 days ago

Ebay Wave Analysis 26 April 2024

- Ebay reversed from support level 49.35 - Likely to rise to resistance level 52.55…

2 days ago

False Alert with Yen Interventions?

Even though the Bank of Japan left the key rate and parameters of the QE…

3 days ago

Cooler Bitcoin

Market picture  Market Dynamics: The cryptocurrency market stabilised, losing just 0.1% of capitalisation and dropping to…

3 days ago

GBPCAD Wave Analysis 25 April 2024

- GBPCAD reversed from key support level 1.6910 - Likely to rise to resistance level…

3 days ago

GBPAUD Wave Analysis 25 April 2024

- GBPAUD reversed from support level 1.9135 - Likely to rise to resistance level 1.9360…

3 days ago

This website uses cookies