- NZDUSD reversed from support area
- Likely to rise to 0.6350
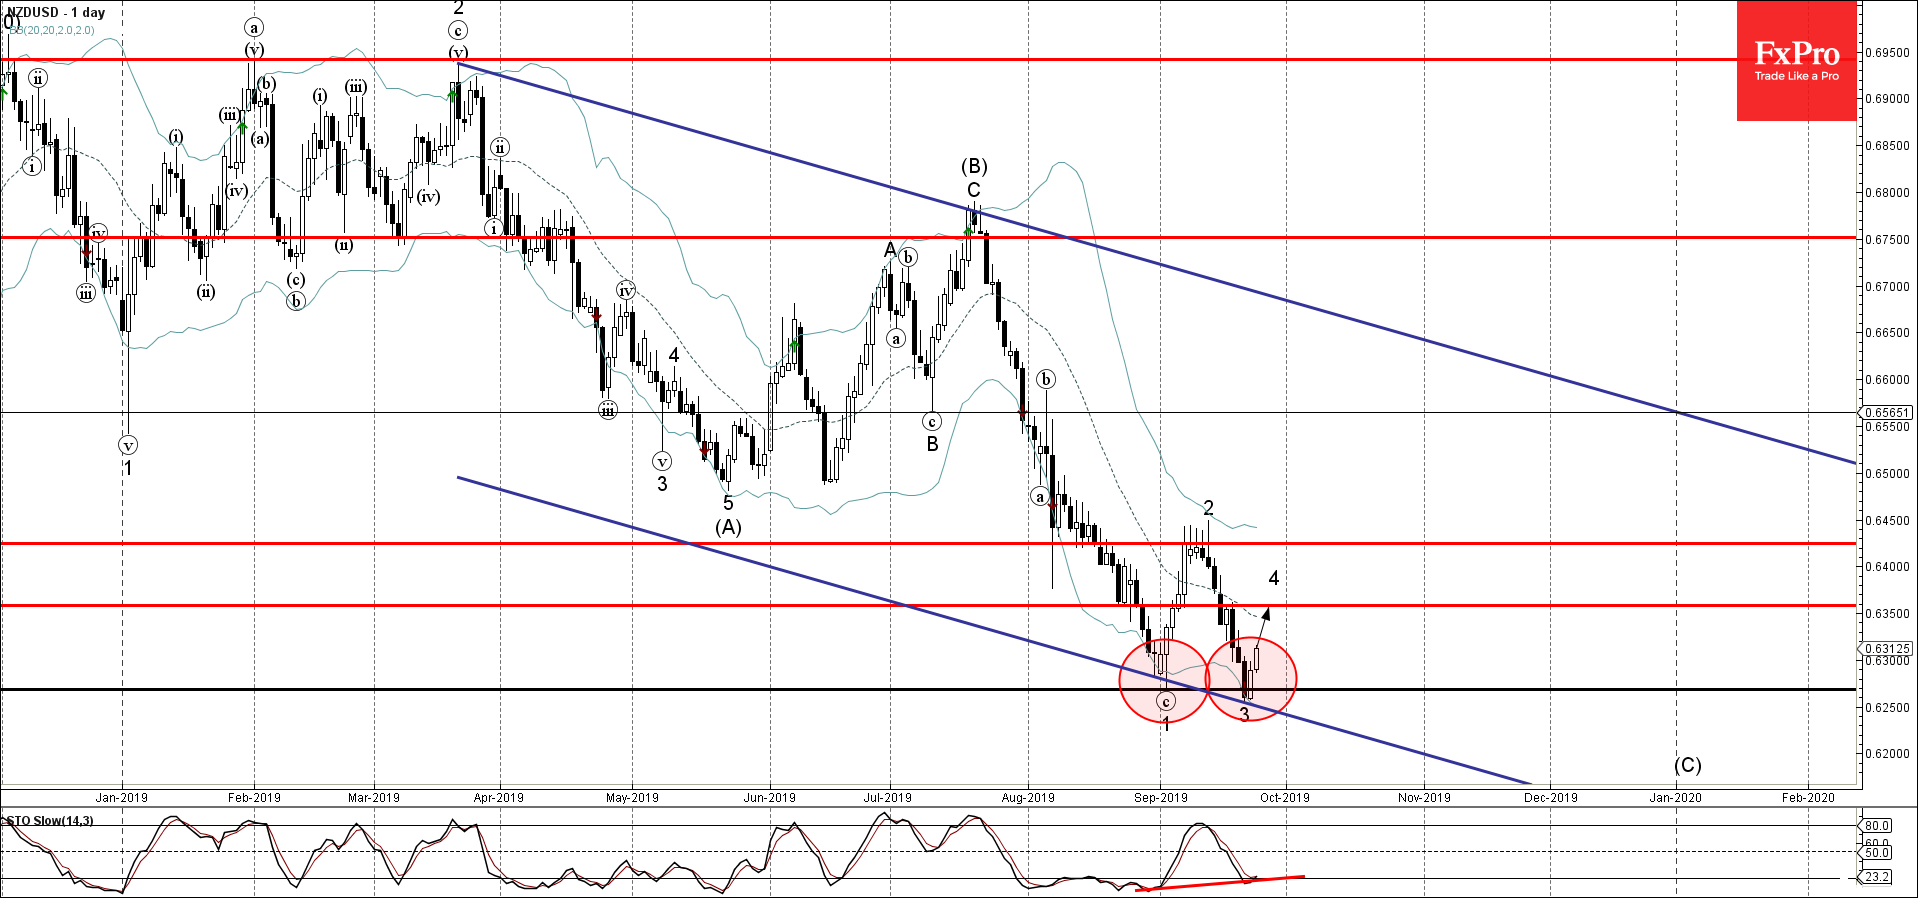
NZDUSD recently reversed up from the support area lying between the support level 0.6270 (low of the previous impulse wave 1), support trendline of the wide down channel from March and the lower daily Bollinger Band.
The upward reversal from this support area created the daily Japanese candlesticks reversal pattern Piercing Line.
With the bullish divergence visible on the daily Stochastic – NZDUSD is expected to rise further and retest the next resistance level 0.6350.