Categories: Technical analysis

NZDUSD Wave Analysis 23 December, 2020

• NZDUSD reversed from support area

• Likely to rise to 0.7200

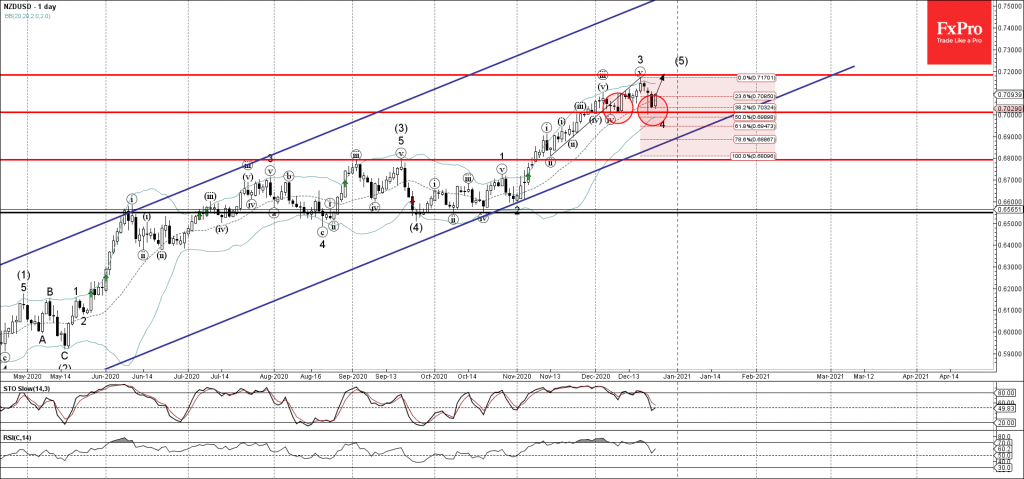
NZDUSD recently reversed up from the support area lying between the pivotal support level 0.7010 (which has been reversing this currency pair from the start of December) and the 38.2% Fibonacci correction of the upward impulse from November.

The upward reversal from this support area is likely to form daily Japanese candlesticks pattern Bullish Engulfing – next to the previous daily Hammer.

Given the prevailing uptrend – NZDUSD is expected to rise further toward the next resistance level 0.7200 (which stopped the previous minor impulse wave 3).

The FxPro Tech Analysis Team

The FxPro technical experts prepare a daily analysis of the most active currency pairs (majors, crosses, exotics) and commodities. Selected instruments are reviewed on daily trends (D1, H4), using the active Elliott Wave setups, Japanese candlesticks, indicators, and support/resistance levels.

Share
Published by
The FxPro Tech Analysis Team
Tags: NZDUSD

Recent Posts

AUDJPY Wave Analysis – 5 December 2025

AUDJPY: ⬆️ Buy - AUDJPY broke long-term resistance level 102.30 - Likely to rise to…

1 day ago

Aptos Wave Analysis – 5 December 2025

Aptos: ⬇️ Sell - Aptos testing major support at 1.688 - Likely to fall to…

1 day ago

Pro News Weekly: Market Shake-Up, Dollar Drops, Gold Surges, Bitcoin Wobbles!

Welcome to Pro News Flash! 💵 The U.S. dollar slips 🏆 Major stock indices struggle…

2 days ago

Solana Wave Analysis – 5 December 2025

Solana: ⬇️ Sell - Solana reversed from resistance zone - Likely to fall to support…

2 days ago

EURAUD Wave Analysis – 5 December 2025

EURAUD : ⬇️ Sell - EURAUD broke the support level 1.7600 - Likely to fall…

2 days ago

Forex has set its priorities

In 2026, experts favour the yen, see modest euro growth, and expect pressure on the…

2 days ago

This website uses cookies