Categories: Technical analysis

NZDUSD Wave Analysis – 21 March, 2019

  • NZDUSD reversed from resistance area
  • Further losses are likely

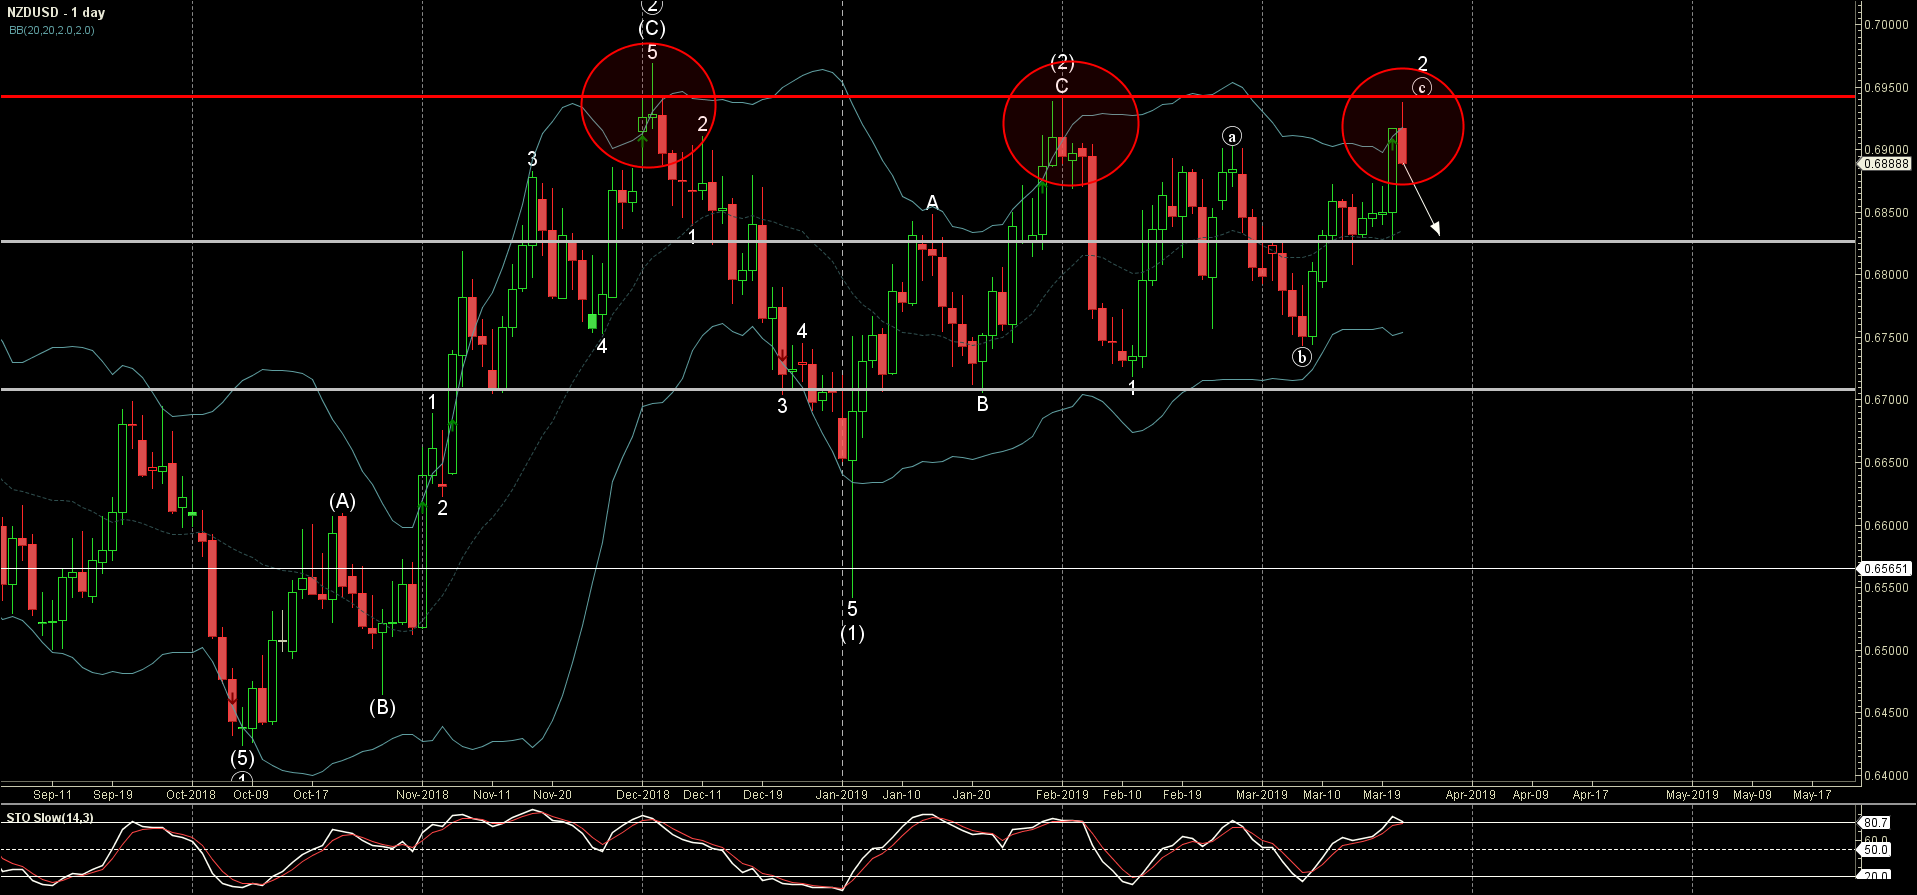
NZDUSD recently reversed down from the resistance area lying between the key resistance level 0.6940 (which has been reversing the price from start of December) and the upper daily Bollinger Band.

This resistance area was further strengthened by the upper weekly Bollinger Band.

Given the overbought reading on the daily Stochastic indicator – NZDUSD is expected to fall further and re-test the next support level 0.6830.

AddThis Website Tools
The FxPro Tech Analysis Team

The FxPro technical experts prepare a daily analysis of the most active currency pairs (majors, crosses, exotics) and commodities. Selected instruments are reviewed on daily trends (D1, H4), using the active Elliott Wave setups, Japanese candlesticks, indicators, and support/resistance levels.

Share
Published by
The FxPro Tech Analysis Team
Tags: NZDUSD

Recent Posts

Tesla Wave Analysis – 21 March 2025

Tesla: ⬆️ Buy - Tesla reversed from support level 220.00 - Likely to rise to…

15 hours ago

Google Wave Analysis – 21 March 2025

Google: ⬆️ Buy - Google reversed from key support level 160.00 - Likely to rise…

15 hours ago

Silver Wave Analysis – 21 March 2025

Silver: ⬇️ Sell - Silver reversed from resistance level 34.00 - Likely to fall to…

16 hours ago

USDCHF Wave Analysis – 21 March 2025

USDCHF: ⬆️ Buy - USDCHF reversed from support level 0,8750 - Likely to fall to…

16 hours ago

What’s next: Flash PMIs, UK CPI & US PCE

The week ahead includes the release of the PMI business activity indexes for March, the…

23 hours ago

Gold: Growth Opportunities

Gold has been in an uptrend, reaching record highs and offering growth opportunities. However, caution…

23 hours ago