Categories: Technical analysis

NZDUSD Wave Analysis – 21 December, 2022

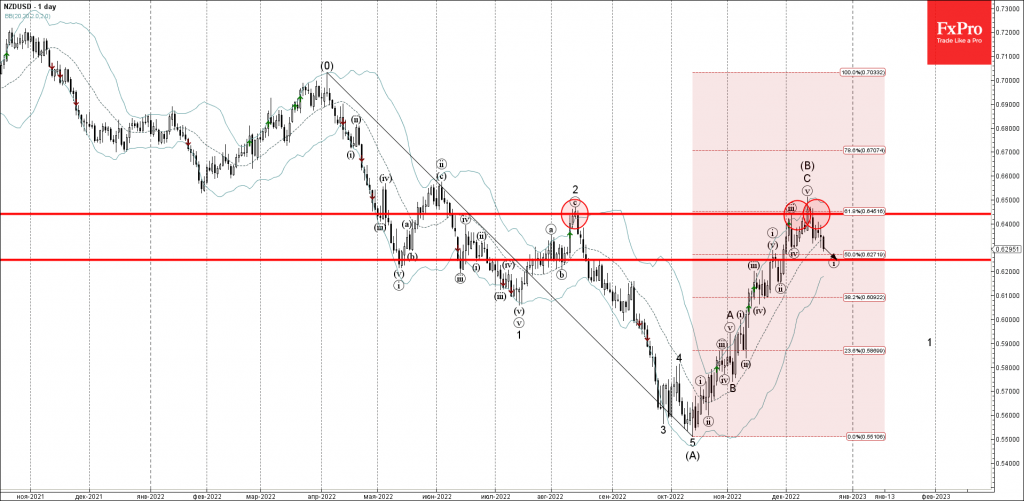
• NZDUSD reversed from key resistance level 0.6440

• Likely to fall to support level 0.6250

NZDUSD recently reversed down from the key resistance level 0.6440 (which has been reversing the pair from middle July, as can be seen below).

The resistance level 0.6440 was further strengthened by the nearby upper daily Bollinger Band and by the 61.8% Fibonacci correction of the downward impulse from last April.

NZDUSD can be expected to fall further toward the next support level 0.6250 (target price for the completion of the active short-term impulse wave (i)).

The FxPro Tech Analysis Team

The FxPro technical experts prepare a daily analysis of the most active currency pairs (majors, crosses, exotics) and commodities. Selected instruments are reviewed on daily trends (D1, H4), using the active Elliott Wave setups, Japanese candlesticks, indicators, and support/resistance levels.

Share
Published by
The FxPro Tech Analysis Team
Tags: NZDUSD

Recent Posts

Crude Oil counteracts

Middle East tensions and Venezuelan supply shifts drive Brent crude volatility, with geopolitical risks and…

3 hours ago

Crypto market grows with risk appetite in stocks

Crypto market edges up as risk appetite returns; Bitcoin and Ethereum recover, despite investor caution…

4 hours ago

The yen returned to the Takaichi trade

The dollar resumed its growth after the lawsuit against the Fed chairman. Rumours of early…

5 hours ago

Nat Gas Current situation #tradelikeapro #trading #natgas #tradingstrategy #tradingshorts

Today is Tuesday, the 13th of January, and we will talk about the natural gas…

7 hours ago

Bitcoin Cash Wave Analysis – 12 January 2026

Bitcoin Cash: ⬇️ Sell - Bitcoin Cash reversed from resistance area - Likely to fall…

16 hours ago

EURJPY Wave Analysis – 12 January 2026

EURJPY: ⬆️ Buy - EURJPY reversed from support area - Likely to rise to resistance…

16 hours ago

This website uses cookies