Categories: Technical analysis

NZDUSD Wave Analysis – 18 May, 2020

• NZDUSD reversed sharply from support zone

• Likely to rise to .6145

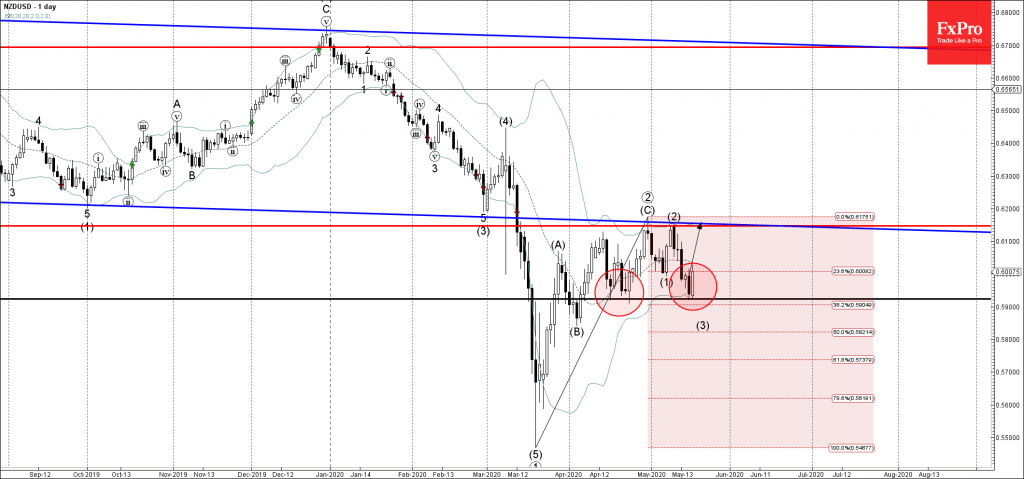
NZDUSD today reversed up sharply from the support zone located between the key support level 0.5923 (which created two consecutive Morning Stars in April), lower daily Bollinger band and the 38.2% Fibonacci correction of the previous ABC correction from March.

The upward reversal from this support area stopped the earlier medium-term impulse wave (3). NZDUSD is likely to rise further toward the next resistance level 0.6145 (intersecting with the lower trendline of the wide down channel from last year).

The FxPro Tech Analysis Team

The FxPro technical experts prepare a daily analysis of the most active currency pairs (majors, crosses, exotics) and commodities. Selected instruments are reviewed on daily trends (D1, H4), using the active Elliott Wave setups, Japanese candlesticks, indicators, and support/resistance levels.

Share
Published by
The FxPro Tech Analysis Team
Tags: NZDUSD

Recent Posts

USDJPY Wave Analysis 26 April 2024

- USDJPY broke key resistance level 155.00 - Likely to rise to resistance level 160.00…

21 hours ago

Ebay Wave Analysis 26 April 2024

- Ebay reversed from support level 49.35 - Likely to rise to resistance level 52.55…

21 hours ago

False Alert with Yen Interventions?

Even though the Bank of Japan left the key rate and parameters of the QE…

1 day ago

Cooler Bitcoin

Market picture  Market Dynamics: The cryptocurrency market stabilised, losing just 0.1% of capitalisation and dropping to…

1 day ago

GBPCAD Wave Analysis 25 April 2024

- GBPCAD reversed from key support level 1.6910 - Likely to rise to resistance level…

2 days ago

GBPAUD Wave Analysis 25 April 2024

- GBPAUD reversed from support level 1.9135 - Likely to rise to resistance level 1.9360…

2 days ago

This website uses cookies