Categories: Technical analysis

NZDUSD Wave Analysis – 18 March, 2020

  • NZDUSD broke round support level 0.6000
  • Likely to fall to 0.5800

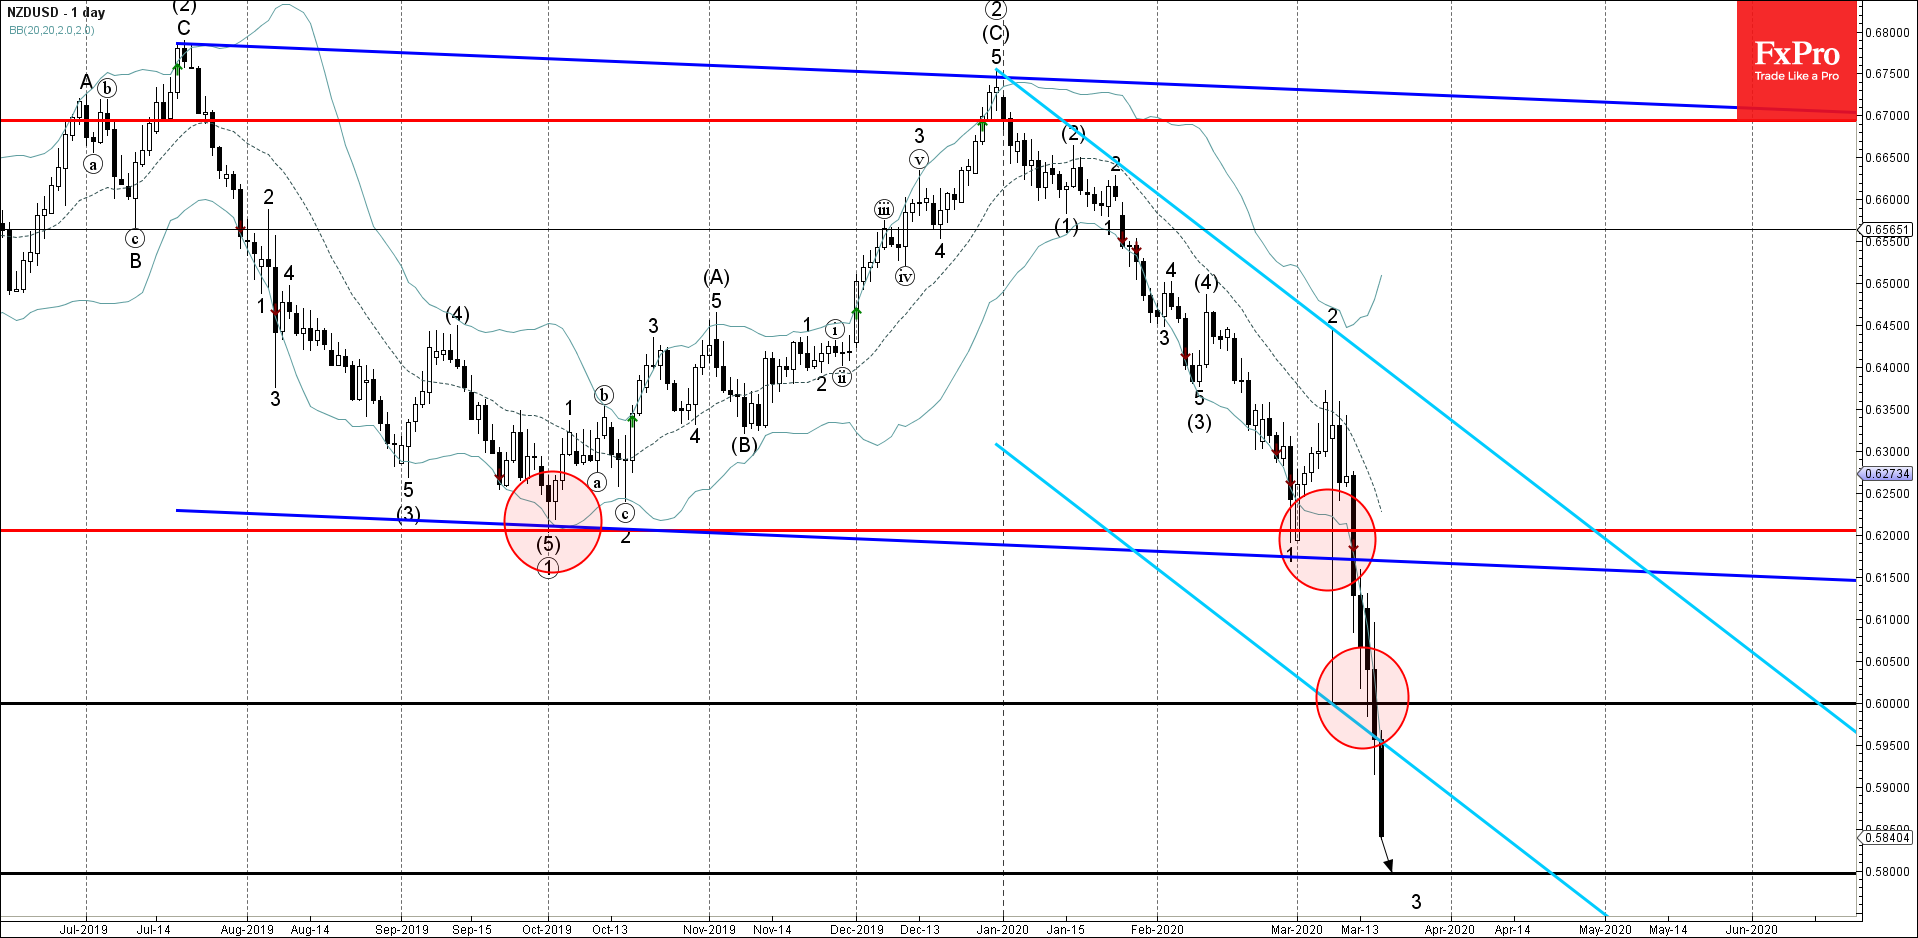
NZDUSD recently broke sharply below the round support level 0.6000 (which previously reversed the price with the daily candlestick pattern Long-legged Doji at the start of March).

The breakout of the support level 0.6000 coincided with the breakout of lower support trendline of the daily down channel from January – which accelerated the active waves 3 and (5)..

NZDUSD is likely to fall further toward the next support level 0,5800 (forecast price for the completion of the active short-term impulse wave 3).

AddThis Website Tools
The FxPro Tech Analysis Team

The FxPro technical experts prepare a daily analysis of the most active currency pairs (majors, crosses, exotics) and commodities. Selected instruments are reviewed on daily trends (D1, H4), using the active Elliott Wave setups, Japanese candlesticks, indicators, and support/resistance levels.

Share
Published by
The FxPro Tech Analysis Team
Tags: NZDUSD

Recent Posts

US sales jump gives USD relief, but is driven by fears

US Total retail sales rose 1.4% in March, beating the expected 1.3% after rising 0.2%…

3 hours ago

Tariff news and resistance zone put pressure on crypto

The crypto market capitalisation decreased by 2.6% in 24 hours due to the announcement of…

6 hours ago

Gold Wave Analysis – 16 April 2025

Gold: ⬆️ Buy - Gold broke resistance zone - Likely to rise to the resistance…

10 hours ago

GBPUSD Wave Analysis – 16 April 2025

GBPUSD: ⬆️ Buy - GBPUSD broke key resistance level 1.3200 - Likely to rise to…

10 hours ago

Platinum Wave Analysis – 15 April 2025

Platinum: ⬆️ Buy - Platinum reversed from support level 905.00 - Likely to rise to…

20 hours ago

USDJPY Wave Analysis – 15 April 2025

USDJPY: ⬆️ Buy - USDJPY reversed from long-term support level 142.00 - Likely to rise…

20 hours ago