Categories: Technical analysis

NZDUSD Wave Analysis 12 February, 2021

• NZDUSD falling inside sideways price range

• Likely to reach support level 0.7100

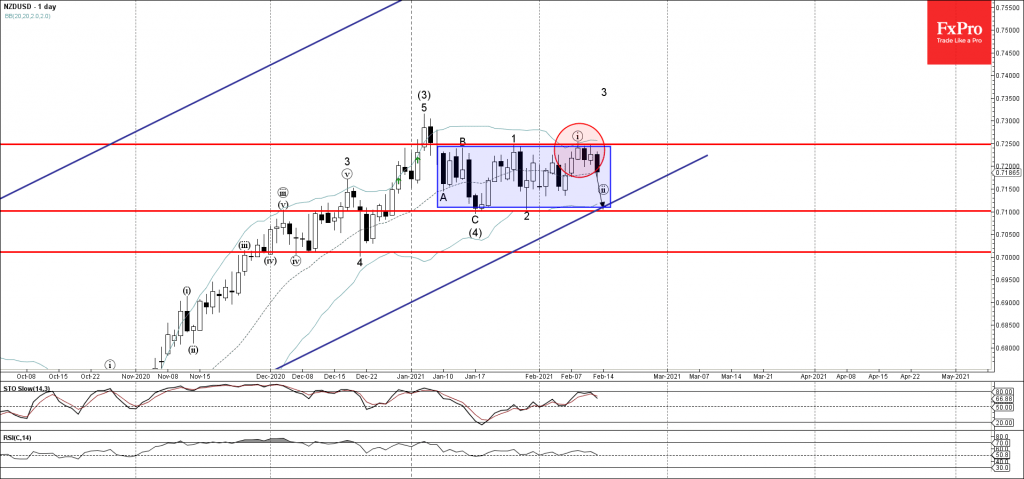
NZDUSD recently reversed down from the pivotal resistance level 0.7250 (upper boundary of the sideways price range inside which the pair has been trading from the start of January) intersecting with the upper daily Bollinger band.

The downward reversal from the resistance level 0.7250 started the active minor correction (ii) which belongs to the impulse wave 3 from the end of January.

NZDUSD can be expected to fall further toward the next support level 0.7100 (low of the previous waves (4) and 2) – coinciding with the daily up channel from 2020.\

The FxPro Tech Analysis Team

The FxPro technical experts prepare a daily analysis of the most active currency pairs (majors, crosses, exotics) and commodities. Selected instruments are reviewed on daily trends (D1, H4), using the active Elliott Wave setups, Japanese candlesticks, indicators, and support/resistance levels.

Share
Published by
The FxPro Tech Analysis Team
Tags: NZDUSD

Recent Posts

How Low Can the USDJPY Go? 

USDJPY was slipping below 153 on Friday morning, a three-week low and having lost over…

34 mins ago

Bitcoin’s Downtrend, Solana and Ethereum Form Double Bottom

Market picture  Crypto market capitalisation rose 3.3% in 24 hours to $2.22 trillion. Local capitalisation…

6 hours ago

EURJPY Wave Analysis 2 May 2024

- EURJPY under strong bearish pressure - Likely to fall to support level 163.10 EURJPY…

20 hours ago

WTI crude oil Wave Analysis 2 May 2024

- WTI broke round support level 80.00 - Likely to fall to support level 76.00…

20 hours ago

ADP hints at another strong NFP on Friday

The monthly ADP labour market report showed that America created 192K new jobs in April, above…

2 days ago

Fed’s hawkish tone risks sinking S&P500 to 4700

Bears showed strength ahead of the FOMC decision.  U.S. indices sagged on Tuesday as investors…

2 days ago

This website uses cookies