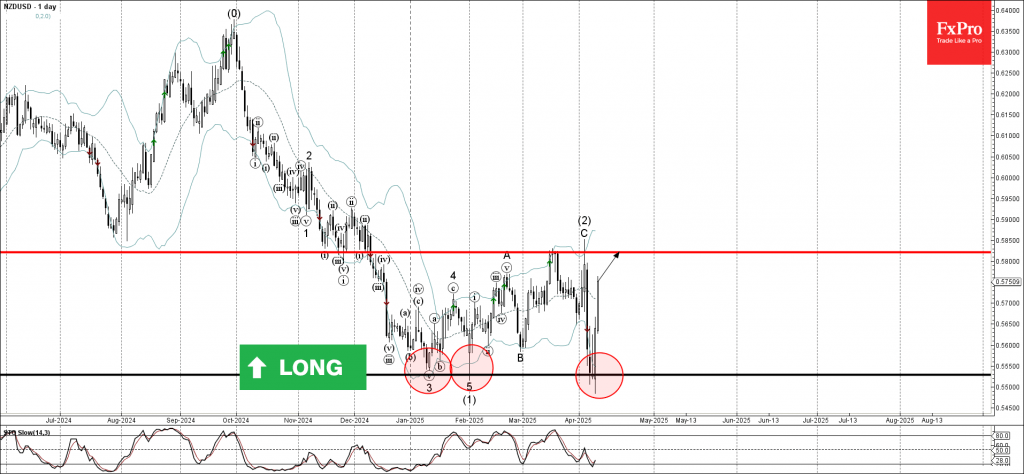
Categories: Technical analysis

NZDUSD Wave Analysis – 10 April 2025

NZDUSD: ⬆️ Buy

– NZDUSD reversed from support zone

– Likely to rise to resistance level 0.5820

NZDUSD currency pair recently reversed from the support zone between the key support level 0.5530 (which has been reversing the price from January) and the lower daily Bollinger Band.

The upward reversal from the support level 0.5530 created the daily Japanese candlesticks reversal pattern Morning Star Doji.

Given the strongly bearish US dollar sentiment, NZDUSD currency pair can be expected to rise to the next resistance level 0.5820.

The FxPro Tech Analysis Team

The FxPro technical experts prepare a daily analysis of the most active currency pairs (majors, crosses, exotics) and commodities. Selected instruments are reviewed on daily trends (D1, H4), using the active Elliott Wave setups, Japanese candlesticks, indicators, and support/resistance levels.

Share
Published by
The FxPro Tech Analysis Team
Tags: NZDUSD

Recent Posts

Central banks did not scare the dollar

•    Central banks prefer to pause. •   The strengthening of the dollar prevented gold from…

2 hours ago

The crypto market is updating its lows but avoiding sharp changes

Market Picture The crypto market set another trap for bulls yesterday afternoon, jumping to $3T…

3 hours ago

JPMorgan Chase Wave Analysis – 18 December 2025

JPMorgan Chase: ⬇️ Sell - JPMorgan Chase reversed from resistance area - Likely to fall…

13 hours ago

EURUSD Wave Analysis – 18 December 2025

EURUSD: ⬇️ Sell - EURUSD reversed from resistance area - Likely to fall to support level…

13 hours ago

AUDJPY Wave Analysis – 18 December 2025

AUDJPY: ⬆️ Buy - AUDJPY reversed from support area - Likely to rise to resistance…

14 hours ago

Palladium Wave Analysis – 18 December 2025

Palladium: ⬆️ Buy - Palladium broke multi-month resistance level 1600.00 - Likely to rise to resistance…

14 hours ago

This website uses cookies