Categories: Technical analysis

NZDUSD Wave Analysis 1 September 2023

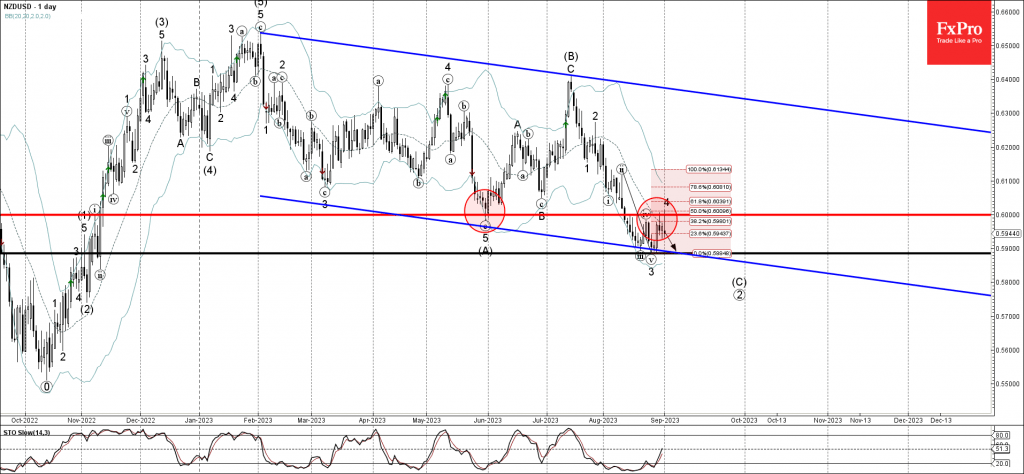
– NZDUSD reversed from resistance level 0.6000

– Likely to fall to support level 0.5900

NZDUSD currency pair recently reversed down from the strong round resistance level 0.6000 (former multi-month support from June), coinciding with the 20-day moving average and the 50% Fibonacci correction of the downward impulse from the start of August.

The downward reversal from the resistance level 0.6000 stopped the wave 4 of the active sharp downward impulse wave C from July.

Given the overriding daily downtrend, NZDUSD can be expected to fall further toward the next support level 0.5900 (low of the previous impulse wave 3).

The FxPro Tech Analysis Team

The FxPro technical experts prepare a daily analysis of the most active currency pairs (majors, crosses, exotics) and commodities. Selected instruments are reviewed on daily trends (D1, H4), using the active Elliott Wave setups, Japanese candlesticks, indicators, and support/resistance levels.

Share
Published by
The FxPro Tech Analysis Team
Tags: NZDUSD

Recent Posts

EURCAD Wave Analysis 6 September 2024

- EURCAD reversed from pivotal support level 1.4900 - Likely to rise to resistance level…

1 day ago

EURUSD Wave Analysis 6 September 2024

- EURUSD reversed from support level 1.1030 - Likely to rise to resistance level 1.1200…

1 day ago

Further Unwinding of Carry Trade

The unwinding of the carry trade in the FX market continues, with the major safe…

1 day ago

Bitcoin pressured by risk-off mood

Market Picture The pressure on risk assets continues, pushing the crypto market capitalisation back below…

2 days ago

AUDUSD Wave Analysis 5 September 2024

- AUDUSD reversed from support level 0.6700 - Likely to rise to resistance level 0.6800…

2 days ago

Gold Wave Analysis 5 September 2024

- Gold reversed from support level 2475.00 - Likely to rise to resistance level 2535.00…

2 days ago

This website uses cookies