Categories: Technical analysis

NZDUSD Wave Analysis – 1 October, 2019

  • NZDUSD broke support zone
  • Likely to fall to 0.6150

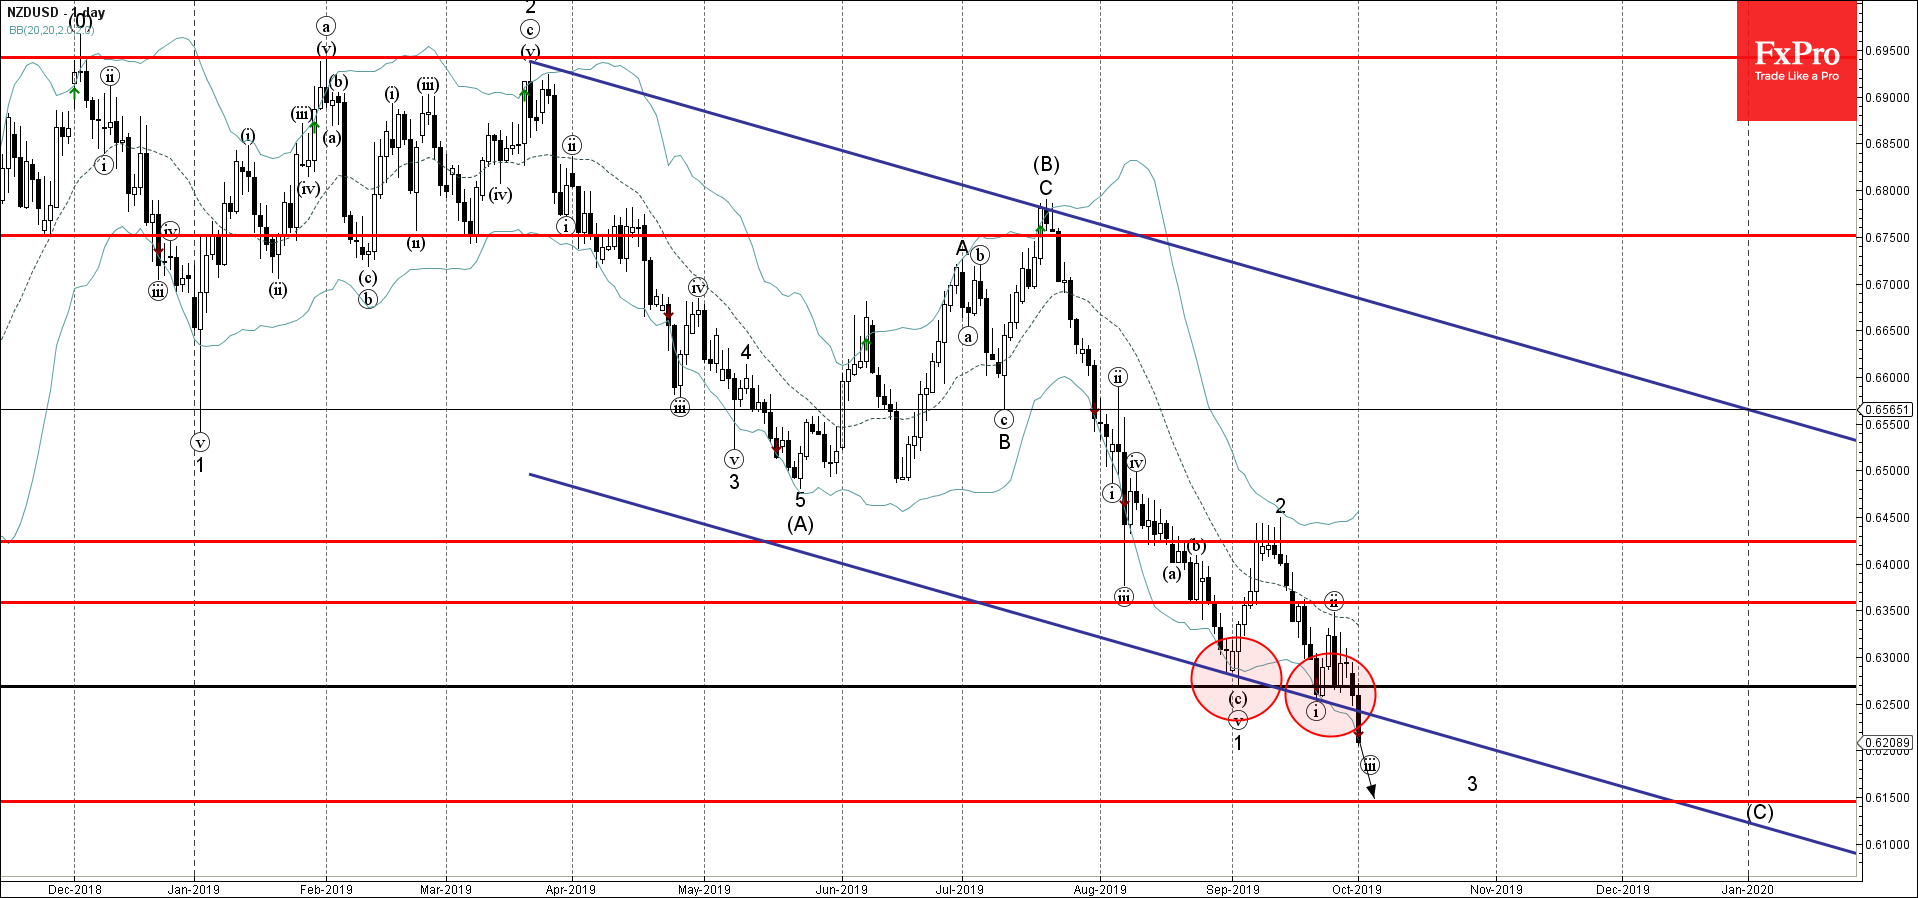
NZDUSD today broke sharply through the support area lying between the support level 0.6270 and the support trendline of the wide daily down channel from March.

The breakout of this support area accelerated the active impulse wave 3 – which belongs to the intermediate impulse wave (C) from July.

NZDUSD is expected to fall further and retest the next support level 0.6150 (target price for the completion of the active impulse wave 3).

The FxPro Tech Analysis Team

The FxPro technical experts prepare a daily analysis of the most active currency pairs (majors, crosses, exotics) and commodities. Selected instruments are reviewed on daily trends (D1, H4), using the active Elliott Wave setups, Japanese candlesticks, indicators, and support/resistance levels.

Share
Published by
The FxPro Tech Analysis Team
Tags: NZDUSD

Recent Posts

EURJPY Wave Analysis 2 May 2024

- EURJPY under strong bearish pressure - Likely to fall to support level 163.10 EURJPY…

3 hours ago

WTI crude oil Wave Analysis 2 May 2024

- WTI broke round support level 80.00 - Likely to fall to support level 76.00…

3 hours ago

ADP hints at another strong NFP on Friday

The monthly ADP labour market report showed that America created 192K new jobs in April, above…

1 day ago

Fed’s hawkish tone risks sinking S&P500 to 4700

Bears showed strength ahead of the FOMC decision.  U.S. indices sagged on Tuesday as investors…

1 day ago

A new stage of Bitcoin’s decline

Market Picture  Bitcoin's closing price on Tuesday became the lowest since late February, confirming the…

2 days ago

Ebay Wave Analysis 30 April 2024

- Ebay under the bearish pressure - Likely to fall to support level 51.00 Ebay…

2 days ago

This website uses cookies