Categories: Technical analysis

NZDUSD Wave Analysis – 07 November , 2018

  • NZDUSD broke resistance zone
  • Further gains are likely

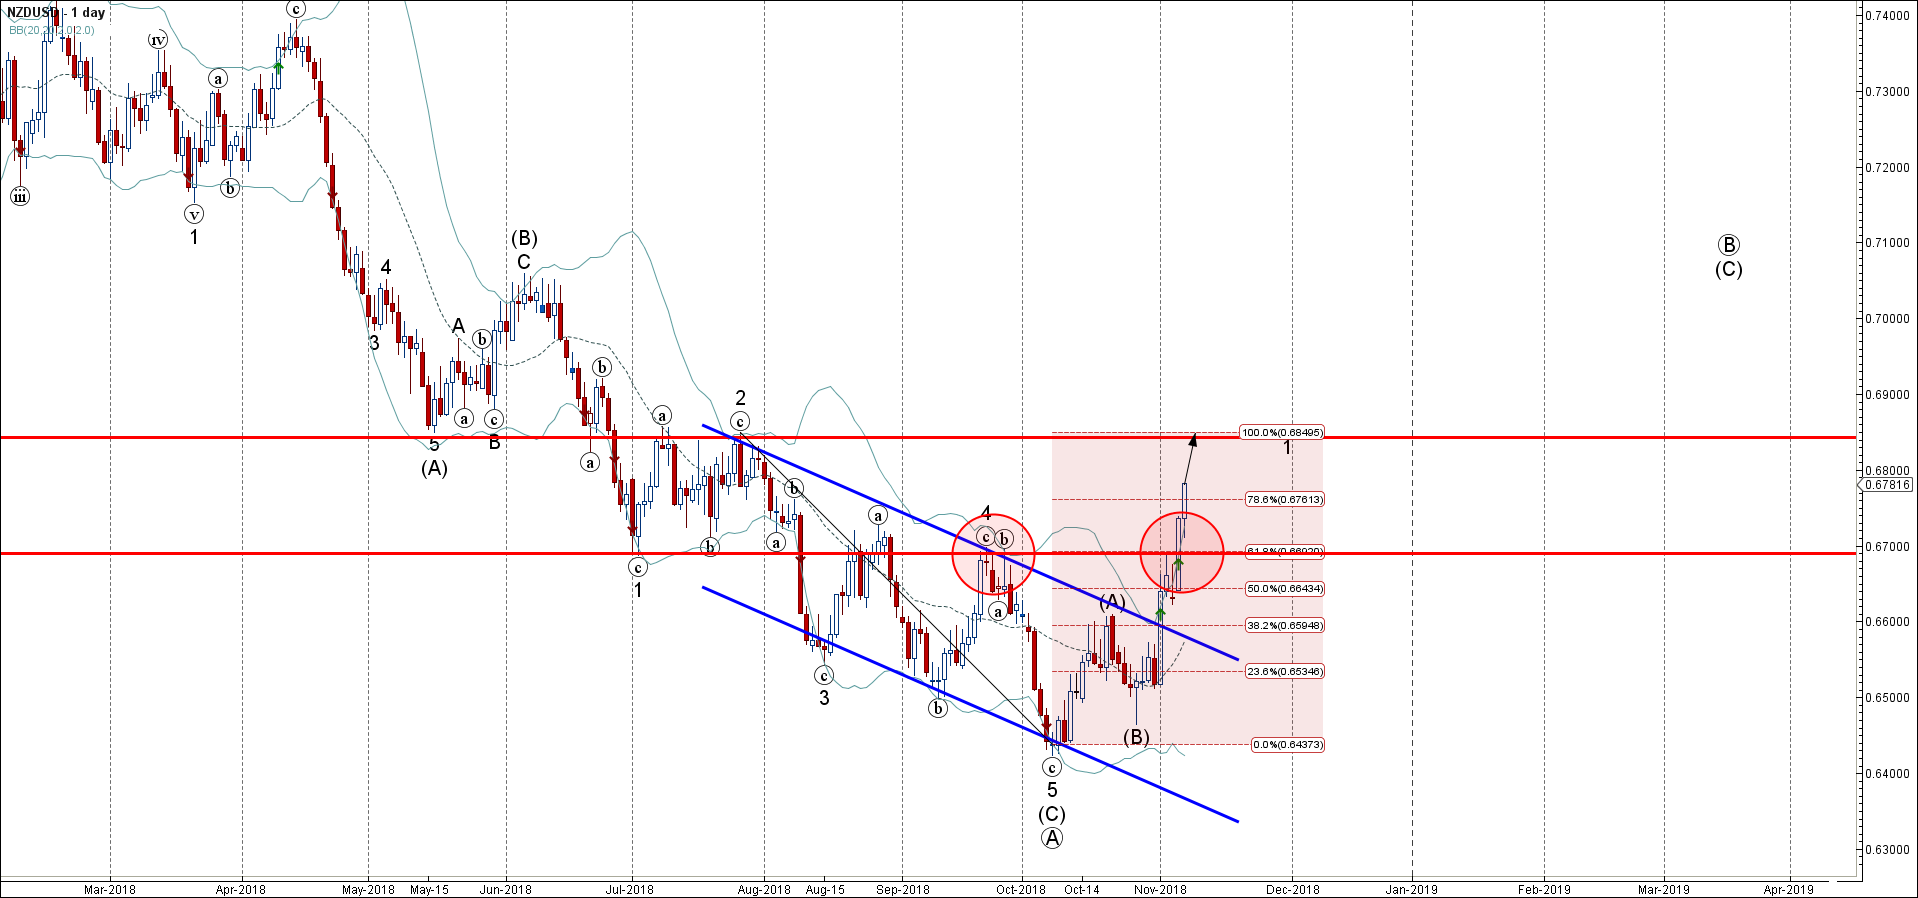
NZDUSD continues to rise after the earlier breakout of the resistance zone located between the key resistance level 0.6700 (top of wave 4 from September) and the 61.8% Fibonacci correction of the previous downward impulse from July.

The breakout of this resistance zone accelerated the active impulse wave (C). This price zone is acting as a strong support zone after it was broken.

NZDUSD is like to rise further and re-test the next resistance level 0.6840 (which reversed the price multiple times in July).


The FxPro Tech Analysis Team

The FxPro technical experts prepare a daily analysis of the most active currency pairs (majors, crosses, exotics) and commodities. Selected instruments are reviewed on daily trends (D1, H4), using the active Elliott Wave setups, Japanese candlesticks, indicators, and support/resistance levels.

Share
Published by
The FxPro Tech Analysis Team
Tags: NZDUSD

Recent Posts

Adobe Wave Analysis 3 May 2024

- Adobe reversed from support zone - Likely to rise to resistance level 500.00 Adobe…

19 hours ago

EURGBP Wave Analysis 3 May 2024

- EURJPY reversed from support zone - Likely to rise to resistance level 0.8625 EURGBP…

19 hours ago

How Low Can the USDJPY Go?

USDJPY was slipping below 153 on Friday morning, a three-week low and having lost over…

1 day ago

Bitcoin’s Downtrend, Solana and Ethereum Form Double Bottom

Market picture  Crypto market capitalisation rose 3.3% in 24 hours to $2.22 trillion. Local capitalisation…

1 day ago

EURJPY Wave Analysis 2 May 2024

- EURJPY under strong bearish pressure - Likely to fall to support level 163.10 EURJPY…

2 days ago

WTI crude oil Wave Analysis 2 May 2024

- WTI broke round support level 80.00 - Likely to fall to support level 76.00…

2 days ago

This website uses cookies