Categories: Technical analysis

NZDJPY Wave Analysis 8 November 2024

– NZDJPY reversed from resistance level 92.00

– Likely to fall to support level 90.40

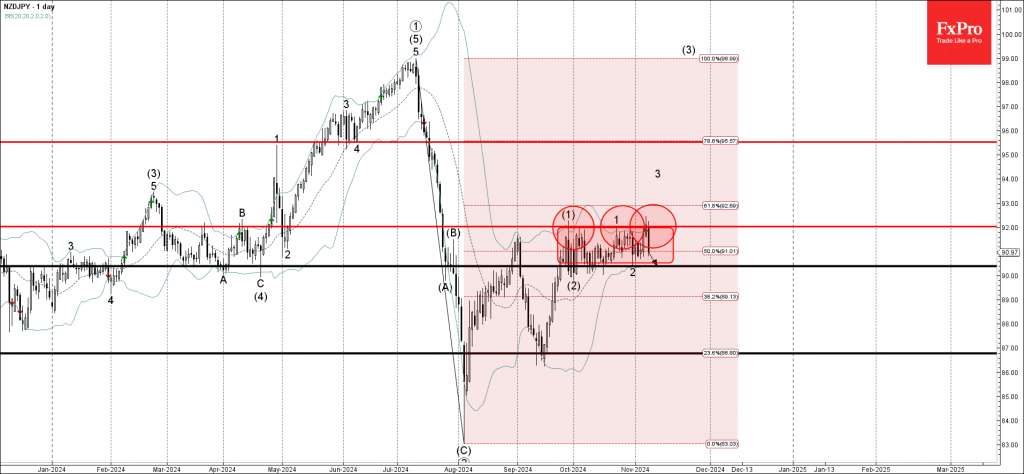
NZDJPY currency pair recently reversed down from the resistance level 92.00, which is the upper boundary of the narrow sideways price range inside which the pair has been moving from September.

The resistance level 92.00 was strengthened by the upper daily Bollinger Band and by the nearby 61.8% Fibonacci correction of the downward impulse from July.

NZDJPY currency pair can be expected to fall to the next support level 90.40 (lower boundary of the aforementioned price range).

The FxPro Tech Analysis Team

The FxPro technical experts prepare a daily analysis of the most active currency pairs (majors, crosses, exotics) and commodities. Selected instruments are reviewed on daily trends (D1, H4), using the active Elliott Wave setups, Japanese candlesticks, indicators, and support/resistance levels.

Share
Published by
The FxPro Tech Analysis Team
Tags: NZDJPY

Recent Posts

EURAUD Wave Analysis – 6 January 2026 Wave Analysis – 6 January 2026

EURAUD: ⬇️ Sell - EURAUD broke strong support level 1.7465 - Likely to fall to…

6 hours ago

IBM Wave Analysis – 6 January 2026

IBM: ⬆️ Buy - IBM reversed from support zone - Likely to rise to resistance…

6 hours ago

Palladium Wave Analysis – 6 January 2026

Palladium: ⬆️ Buy - Palladium reversed from round support level 1600.00 - Likely to rise…

6 hours ago

Amazon Wave Analysis – 6 January 2026

Amazon: ⬆️ Buy - Amazon broke resistance zone - Likely to rise to resistance level…

6 hours ago

Pro News Flash: Gold Bulls Take Control

🥇 Gold is regaining momentum as investors lean into geopolitics, a softer US dollar and…

13 hours ago

The dollar is forced to retreat

• The reduction in geopolitical risks in Venezuela has weakened the greenback. •  Precious metal investors…

16 hours ago

This website uses cookies