Categories: Technical analysis

NZDJPY Wave Analysis – 30 May 2023

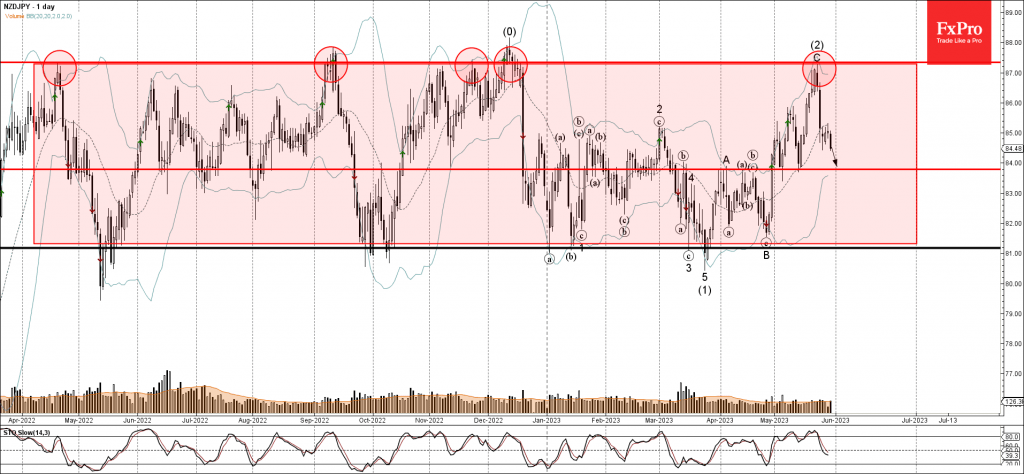
• NZDJPY falling inside impulse wave (3)

• Likely to reach support level 83.80

NZDJPY currency pair continues to fall inside the intermediate impulse wave (3), which started earlier from the key resistance level 87.35 (upper border of the wide weekly sideways price range inside which the pair has been trading from last year).

The current impulse wave (3) belongs to the intermediate downward impulse sequence (3) from the start of December.

NZDJPY can be expected to fall further toward the next support level 83.80 (which reversed the pair sharply twice earlier this month).

AddThis Website Tools
The FxPro Tech Analysis Team

The FxPro technical experts prepare a daily analysis of the most active currency pairs (majors, crosses, exotics) and commodities. Selected instruments are reviewed on daily trends (D1, H4), using the active Elliott Wave setups, Japanese candlesticks, indicators, and support/resistance levels.

Share
Published by
The FxPro Tech Analysis Team
Tags: NZDJPY

Recent Posts

Crypto Market Testing Resistance

The crypto market has increased by over 5% and is nearing the $2.9 trillion. The…

4 hours ago

Gold Wave Analysis – 19 March 2025

Gold: ⬆️ Buy - Gold continues daily uptrend - Likely to rise to resistance level…

18 hours ago

EURJPY Wave Analysis – 19 March 2025

EURJPY: ⬇️ Sell - EURJPY reversed from resistance zone - Likely to fall to support…

18 hours ago

NZDUSD Wave Analysis – 19 March 2025

NZDUSD: ⬇️ Sell - NZDUSD reversed from the resistance level 0.5820 - Likely to fall…

1 day ago

EURUSD Wave Analysis – 19 March 2025

EURUSD: ⬇️ Sell - EURUSD reversed from resistance level 1.0930 - Likely to fall to…

1 day ago

Ethereum gives way

The crypto market remains in a downtrend, with Ethereum losing market share while Bitcoin's share…

1 day ago