Categories: Technical analysis

NZDJPY Wave Analysis 20 November, 2020

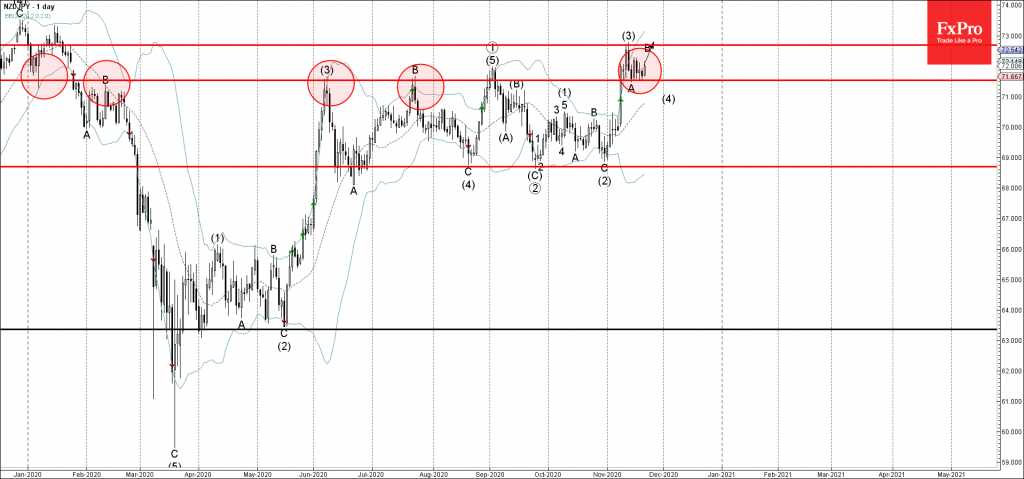
• NZDJPY reversed from support level 71.60

• Likely to rise to 72.70

NZDJPY continues to rise inside the upward correction B, which started earlier from the strong support level 71.60 (former powerful resistance which has been reversing the price from February).

The active wave B belongs to the medium-term ABC correction (4) from the start of November.

Given the clear daily uptrend and the rising NZD bullishness – NZDJPY is likely to rise further toward the next resistance level 72.70 (top of the previous wave (3) and the target price for the completion of the active correction B).

The FxPro Tech Analysis Team

The FxPro technical experts prepare a daily analysis of the most active currency pairs (majors, crosses, exotics) and commodities. Selected instruments are reviewed on daily trends (D1, H4), using the active Elliott Wave setups, Japanese candlesticks, indicators, and support/resistance levels.

Share
Published by
The FxPro Tech Analysis Team
Tags: NZDJPY

Recent Posts

Bitcoin Cash Wave Analysis – 12 January 2026

Bitcoin Cash: ⬇️ Sell - Bitcoin Cash reversed from resistance area - Likely to fall…

11 hours ago

EURJPY Wave Analysis – 12 January 2026

EURJPY: ⬆️ Buy - EURJPY reversed from support area - Likely to rise to resistance…

11 hours ago

Gold shines on an anti-fiat thesis

The dollar suffered due to threats to the Fed’s independence. Gold managed to renew its…

20 hours ago

SP500 Current situation #trading #tradelikeapro #sp500 #tradingshorts #tradingstrategy

Today is Monday, the 12th of January, and once again we will talk about the…

21 hours ago

Crypto: sell-the-growth continues

Crypto markets remain volatile; Bitcoin faces selling pressure, XRP slips, Monero surges, and market signals…

22 hours ago

CHFJPY Wave Analysis – 9 January 2026

CHFJPY: ⬆️ Buy - CHFJPY reversed from support area - Likely to rise to resistance…

4 days ago

This website uses cookies