Categories: Technical analysis

NZDJPY Wave Analysis – 18 May, 2020

• NZDJPY reversed from support area

• Likely to rise to 65.70

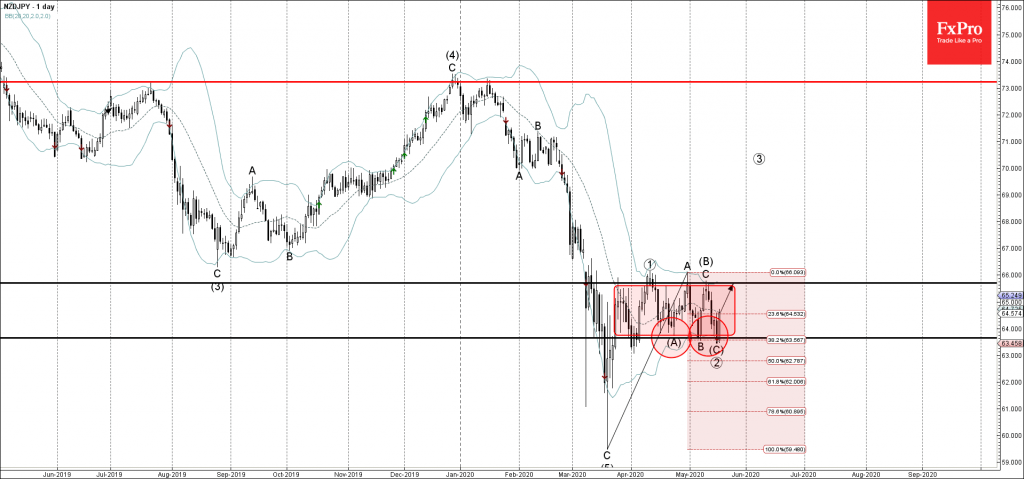
NZDJPY today reversed up from the support area lying between the support level 63.60 (lower boundary of the sideways price range from March), lower daily Bollinger band and the 38.2% Fibonacci correction of the previous upward impulse (i) from March.

The upward reversal from this support area is likely to create the daily Bullish Engulfing – if the pair closes today near the current levels. NZDJPY is likely to rise further toward the next round resistance level 65.70 (lower boundary of the active sideways price range).

The FxPro Tech Analysis Team

The FxPro technical experts prepare a daily analysis of the most active currency pairs (majors, crosses, exotics) and commodities. Selected instruments are reviewed on daily trends (D1, H4), using the active Elliott Wave setups, Japanese candlesticks, indicators, and support/resistance levels.

Share
Published by
The FxPro Tech Analysis Team

Recent Posts

ADP hints at another strong NFP on Friday  

The monthly ADP labour market report showed that America created 192K new jobs in April, above…

4 hours ago

Fed’s hawkish tone risks sinking S&P500 to 4700

Bears showed strength ahead of the FOMC decision.  U.S. indices sagged on Tuesday as investors…

8 hours ago

A new stage of Bitcoin’s decline

Market Picture  Bitcoin's closing price on Tuesday became the lowest since late February, confirming the…

11 hours ago

Ebay Wave Analysis 30 April 2024

- Ebay under the bearish pressure - Likely to fall to support level 51.00 Ebay…

1 day ago

GBPAUD Wave Analysis 30 April 2024

- GBPAUD reversed from key support level 1.9135 - Likely to rise to resistance level…

1 day ago

Silver: a possible long road down

Silver has lost 2.6% since the start of the day on Tuesday to $26.4 per…

1 day ago

This website uses cookies