Categories: Technical analysis

NZDJPY Wave Analysis – 16 March 2023

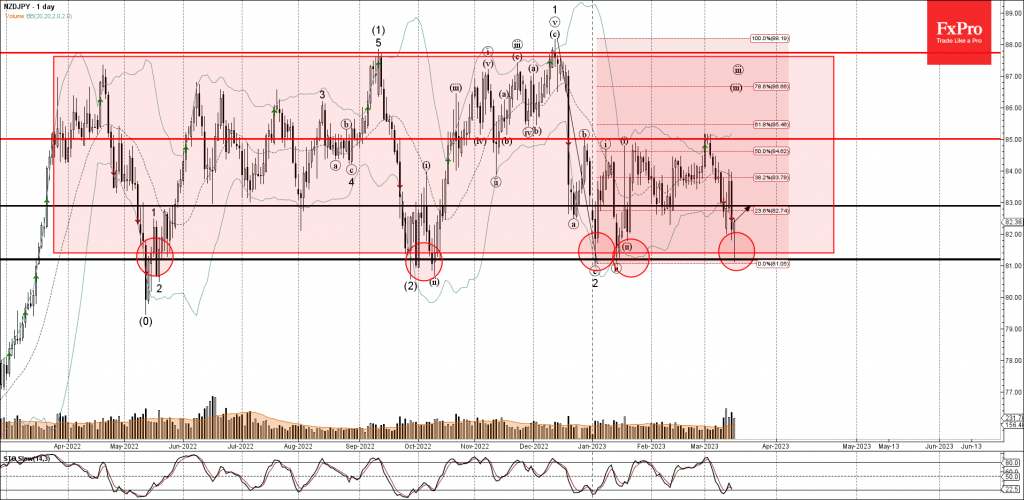
• NZDJPY reversed from support level 81.20

• Likely to rise to resistance level 83.00

NZDJPY currency pair recently reversed up from the key support level 81.20 (lower boundary of the wide sideways price range inside which the price has been moving from last April).

The upward reversal from the support level 81.20 created the daily candlesticks reversal pattern Hammer.

NZDJPY currency pair can be expected to rise further toward the next resistance level 83.00 (former support from the start of February).

The FxPro Tech Analysis Team

The FxPro technical experts prepare a daily analysis of the most active currency pairs (majors, crosses, exotics) and commodities. Selected instruments are reviewed on daily trends (D1, H4), using the active Elliott Wave setups, Japanese candlesticks, indicators, and support/resistance levels.

Share
Published by
The FxPro Tech Analysis Team
Tags: NZDJPY

Recent Posts

S&P 500 Wave Analysis 7 May 2024

- S&P 500 reversed from support level 5000.00 - Likely to rise to resistance level…

1 hour ago

USDCHF Wave Analysis 7 May 2024

- USDCHF reversed from support zone - Likely to rise to resistance level 0.9200 USDCHF…

1 hour ago

EURUSD at the equilibrium, where will it go next?

The single currency is trading near $1.076, waiting for further cues and facing serious resistance…

6 hours ago

Bitcoin can’t accelerate but won’t give up trying

Market picture  The crypto market capitalisation fell by 1.7% in 24 hours to $2.29 trillion,…

11 hours ago

USDJPY Wave Analysis 6 May 2024

- USDJPY reversed from support zone - Likely to rise to resistance level 155.65 USDJPY…

1 day ago

Gold Wave Analysis 6 May 2024

- Gold reversed from support zone - Likely to rise to resistance level 2400.00 Gold…

1 day ago

This website uses cookies