Technical analysis

NZDJPY Wave Analysis – 14 January 2026

NZDJPY: ⬇️ Sell

– NZDJPY reversed down from the resistance area

– Likely to fall to support level 90.00

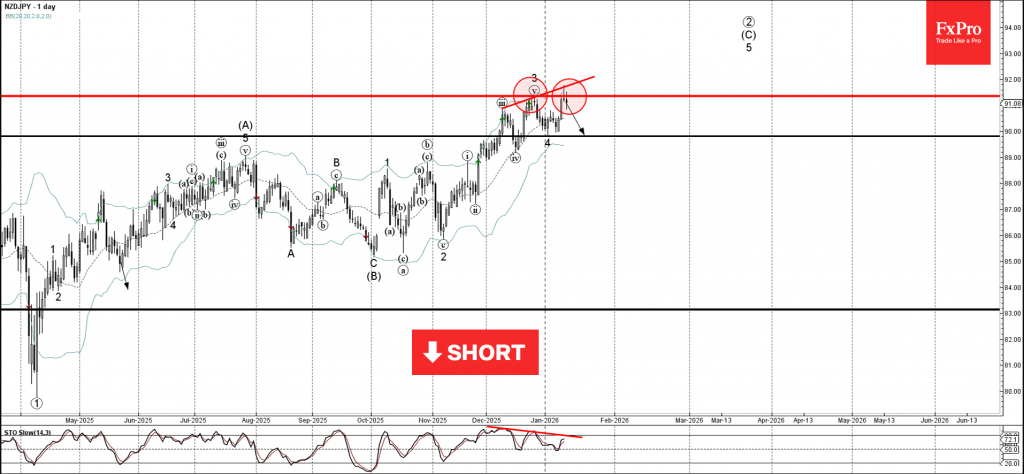
NZDJPY currency pair recently reversed down from the resistance area between the pivotal resistance level 91.35 (which stopped the previous impulse wave 3 at the end of December) and the upper daily Bollinger Band.

The downward reversal from this resistance area created the daily Japanese candlesticks reversal pattern Shooting Star Doji.

Given the strength of the resistance level 91.35 and the bearish divergence on the daily Stochastic, NZDJPY currency pair cryptocurrency can be expected to fall to the next support level 90.00 (which reversed the previous correction 4).

The FxPro Tech Analysis Team

The FxPro technical experts prepare a daily analysis of the most active currency pairs (majors, crosses, exotics) and commodities. Selected instruments are reviewed on daily trends (D1, H4), using the active Elliott Wave setups, Japanese candlesticks, indicators, and support/resistance levels.

Share
Published by
The FxPro Tech Analysis Team
Tags: NZDJPY

Recent Posts

Bitcoin Wave Analysis – 14 January 2026

Bitcoin: ⬆️ Buy - Bitcoin broke resistance area - Likely to rise to resistance level…

1 hour ago

What is Leverage?

Leverage is a mechanism that lets traders control larger positions using smaller capital. By choosing…

6 hours ago

The dollar does not tolerate dissent

US GDP growth is driven not by the White House, but by AI. The Bank…

12 hours ago

The crypto market has made a breakthrough

The crypto market surges, hitting new highs, with bullish sentiment for Bitcoin and Ethereum amid…

12 hours ago

Brent Crude oil Wave Analysis – 13 January 2026

Brent Crude oil ⬆️ Buy - Brent Crude oil rising inside impulse wave c -…

1 day ago

USDJPY Wave Analysis – 13 January 2026

USDJPY ⬆️ Buy - USDJPY broke resistance area - Likely to rise to resistance level…

1 day ago

This website uses cookies