Categories: Technical analysis

NZDJPY Wave Analysis 13 October 2023

– NZDJPY under bearish pressure

– Likely to fall to support level 87.55

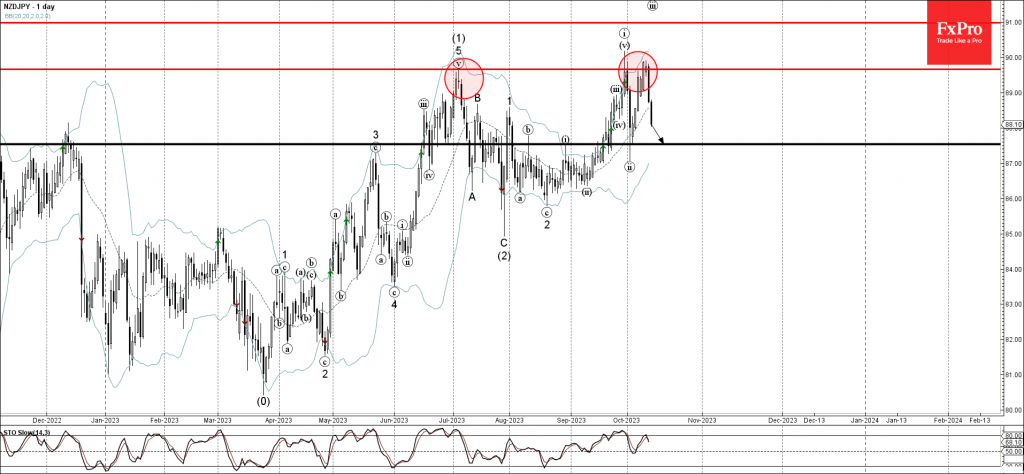
NZDJPY under the bearish pressure after the earlier downward reversal from the strong resistance level 89.70 (previous multi-month high from July) coinciding with the upper daily Bollinger Band.

The downward reversal from the resistance level 89.70 created the daily Japanese candlesticks reversal pattern Evening Star Doji, highlighted below.

Give the strength of the resistance level 89.70 and the strong NZD sales, NZDJPY can be expected to fall further toward the next support level 87.55 (former resistance from August).

The FxPro Tech Analysis Team

The FxPro technical experts prepare a daily analysis of the most active currency pairs (majors, crosses, exotics) and commodities. Selected instruments are reviewed on daily trends (D1, H4), using the active Elliott Wave setups, Japanese candlesticks, indicators, and support/resistance levels.

Share
Published by
The FxPro Tech Analysis Team
Tags: NZDJPY

Recent Posts

Weak Chinese data paves the way for lower yuan

Saturday's statistics from China added to fears of a slowdown in the world's second-largest economy,…

5 hours ago

A new local peak in crypto?

Market Picture The crypto market started the weekend on a positive note but has been…

11 hours ago

Fed rate decision: intrigue returns

Influential financial media are promoting the need for a 50-basis point rate cut. The Fed's…

2 days ago

GBPCAD Wave Analysis 13 September 2024

GBPCAD reversed from strong resistance level 1.7850 Likely to fall to support level 1.7700 GBPCAD…

3 days ago

Ebay Wave Analysis 13 September 2024

- Ebay broke resistance level 62.00   - Likely to rise to the resistance level…

3 days ago

Gold broke through the ceiling

After three weeks of consolidation, gold moved decisively upwards, hitting a record above $2572 per…

3 days ago

This website uses cookies