Categories: Technical analysis

NZDJPY Wave Analysis 11 November, 2020

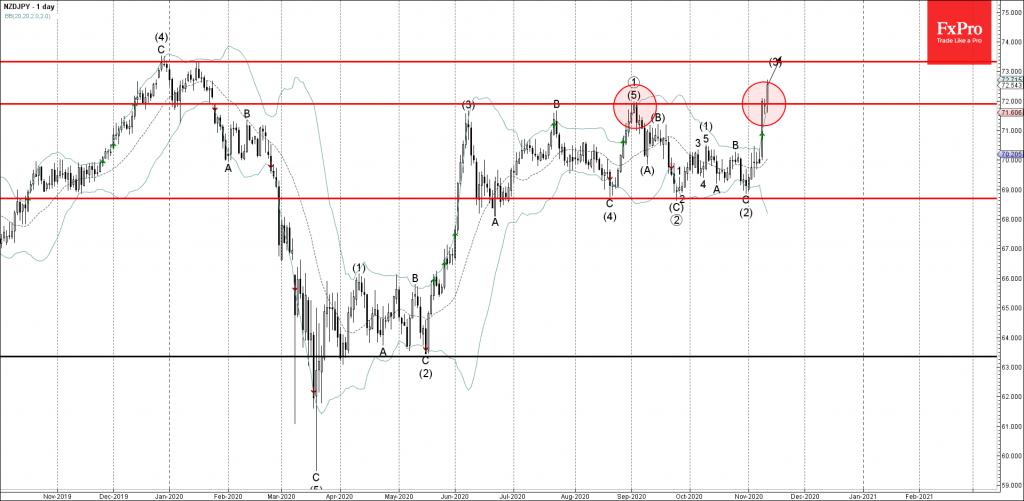
• NZDJPY broke key resistance level 72.00

• Likely to rise to 73.30

NZDJPY continues to rise after the earlier breakout of the key resistance level 72.00 (which stopped the previous sharp impulse wave (5) at the end of August).

The breakout of the resistance level 72.00 accelerated the active medium-term impulse wave (3) from the end of October.

NZDJPY is likely to rise further toward the next resistance level 73.30  – monthly high from January and the target price for the completion of the active impulse wave (3)).

The FxPro Tech Analysis Team

The FxPro technical experts prepare a daily analysis of the most active currency pairs (majors, crosses, exotics) and commodities. Selected instruments are reviewed on daily trends (D1, H4), using the active Elliott Wave setups, Japanese candlesticks, indicators, and support/resistance levels.

Share
Published by
The FxPro Tech Analysis Team
Tags: NZDJPY

Recent Posts

A slightly weaker CPI was not enough to break through the highs

US CPI data a bit softer than forecasts, sparking brief market optimism, but resistance remains.…

1 hour ago

Pro News Flash: Global Tensions Fuel a Fresh Oil Rally

🛢️ Oil prices are finding fresh strength as geopolitical tensions in the Middle East reignite…

1 hour ago

Crude Oil counteracts

Middle East tensions and Venezuelan supply shifts drive Brent crude volatility, with geopolitical risks and…

5 hours ago

Crypto market grows with risk appetite in stocks

Crypto market edges up as risk appetite returns; Bitcoin and Ethereum recover, despite investor caution…

5 hours ago

The yen returned to the Takaichi trade

The dollar resumed its growth after the lawsuit against the Fed chairman. Rumours of early…

7 hours ago

Nat Gas Current situation #tradelikeapro #trading #natgas #tradingstrategy #tradingshorts

Today is Tuesday, the 13th of January, and we will talk about the natural gas…

8 hours ago

This website uses cookies