Categories: Technical analysis

NZDJPY Wave Analysis – 11 June, 2020

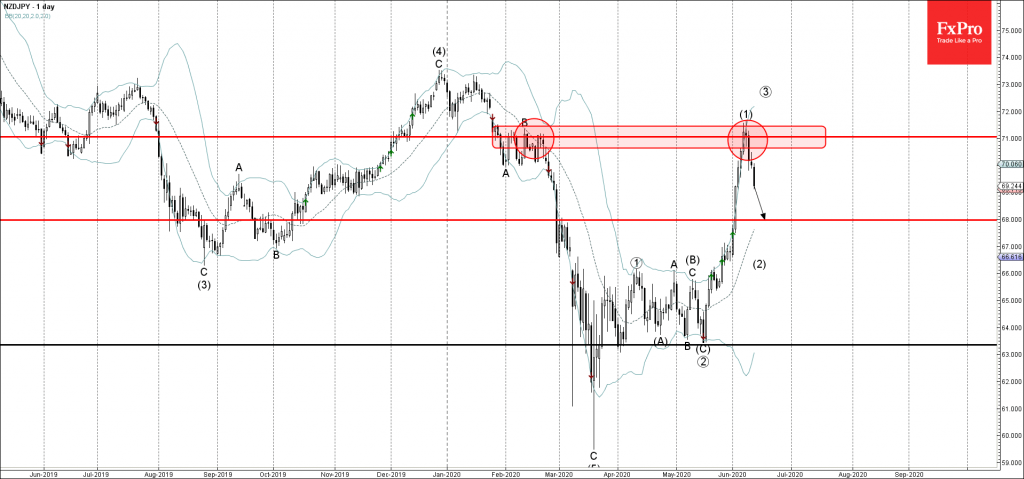
• NZDJPY falling inside wave (2)

• Likely to fall to 68,00

NZDJPY falling sharply inside the medium-term downward corrective wave (2), which started earlier from the resistance area lying between the resistance level 71,00 (middle of the previous resistance cluster from February) and the upper daily Bollinger Band.

The downward reversal from the resistance level 71,00 created the combined daily Japanese candlesticks reversal pattern Evening Star Doji.

NZDJPY is likely to fall further toward the next support level 68,00 (former resistance level from the start of March).

The FxPro Tech Analysis Team

The FxPro technical experts prepare a daily analysis of the most active currency pairs (majors, crosses, exotics) and commodities. Selected instruments are reviewed on daily trends (D1, H4), using the active Elliott Wave setups, Japanese candlesticks, indicators, and support/resistance levels.

Share
Published by
The FxPro Tech Analysis Team
Tags: NZDJPY

Recent Posts

Crypto: sell-the-growth continues

Crypto markets remain volatile; Bitcoin faces selling pressure, XRP slips, Monero surges, and market signals…

8 minutes ago

CHFJPY Wave Analysis – 9 January 2026

CHFJPY: ⬆️ Buy - CHFJPY reversed from support area - Likely to rise to resistance…

3 days ago

Exxon Mobil Wave Analysis – 9 January 2026

Exxon Mobil: ⬆️ Buy - Exxon Mobil reversed from support area - Likely to rise…

3 days ago

Pro News Weekly: Dollar Rebounds as Markets Test New Limits

Welcome to Pro News Weekly! Here’s what is shaping the markets: 💵 The U.S. dollar…

3 days ago

Geopolitics will destroy the euro

•    EURUSD falls due to geopolitics and expectations of tariff removal •    Gold returns to…

3 days ago

Platinum Wave Analysis – 8 January 2026

Platinum: ⬇️ Sell - Platinum reversed from pivotal resistance level 150.00 - Likely to fall to…

4 days ago

This website uses cookies