Categories: Technical analysis

NZDJPY Wave Analysis – 10 June, 2022

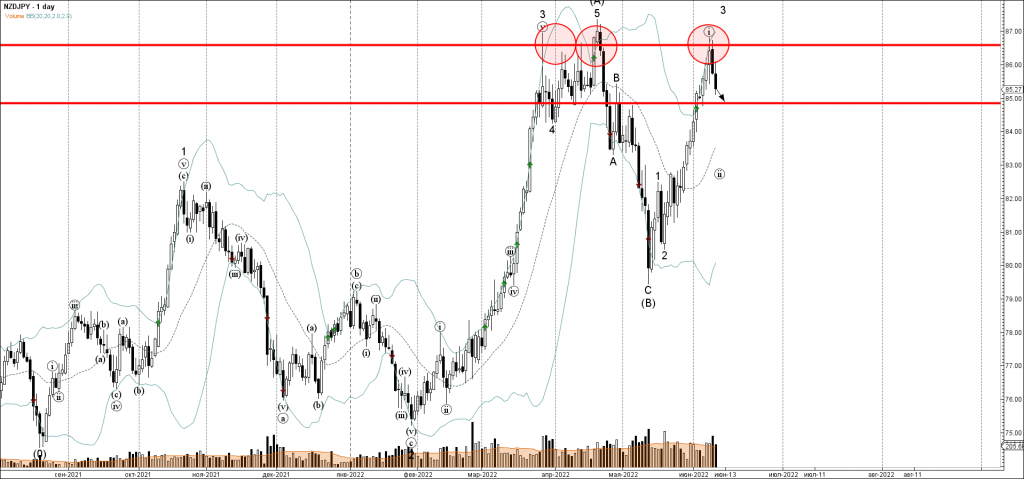
• NZDJPY reversed from resistance level 86.60
• Likely to fall to support level 85.00

NZDJPY currency pair recently reversed down from the key resistance level 86.60 (which has been stopping all upward impulses since the end of April), coinciding with the upper daily Bollinger Band.

The downward reversal from the resistance level 86.60 started the active minor correction (ii).

NZDJPY can be expected to fall further toward the next support level 85.00 (former resistance from the start of May).

The FxPro Tech Analysis Team

The FxPro technical experts prepare a daily analysis of the most active currency pairs (majors, crosses, exotics) and commodities. Selected instruments are reviewed on daily trends (D1, H4), using the active Elliott Wave setups, Japanese candlesticks, indicators, and support/resistance levels.

Share
Published by
The FxPro Tech Analysis Team
Tags: NZDJPY

Recent Posts

Brent Crude oil Wave Analysis – 13 January 2026

Brent Crude oil ⬆️ Buy - Brent Crude oil rising inside impulse wave c -…

20 minutes ago

USDJPY Wave Analysis – 13 January 2026

USDJPY ⬆️ Buy - USDJPY broke resistance area - Likely to rise to resistance level…

21 minutes ago

Exxon Mobil Wave Analysis – 13 January 2026

Exxon Mobil ⬆️ Buy - Exxon Mobil broke resistance level 125.60 - Likely to rise…

22 minutes ago

BNB Wave Analysis – 13 January 2026

Brent Crude oil ⬆️ Buy - BNB broke out of sideways price range - Likely…

23 minutes ago

A slightly weaker CPI was not enough to break through the highs

US CPI data a bit softer than forecasts, sparking brief market optimism, but resistance remains.…

6 hours ago

Pro News Flash: Global Tensions Fuel a Fresh Oil Rally

🛢️ Oil prices are finding fresh strength as geopolitical tensions in the Middle East reignite…

6 hours ago

This website uses cookies