Categories: Technical analysis

NZDJPY Wave Analysis – 03 Janaury, 2019

  • NZDJPY broke multi-month support level 72.20
  • Further losses are likely

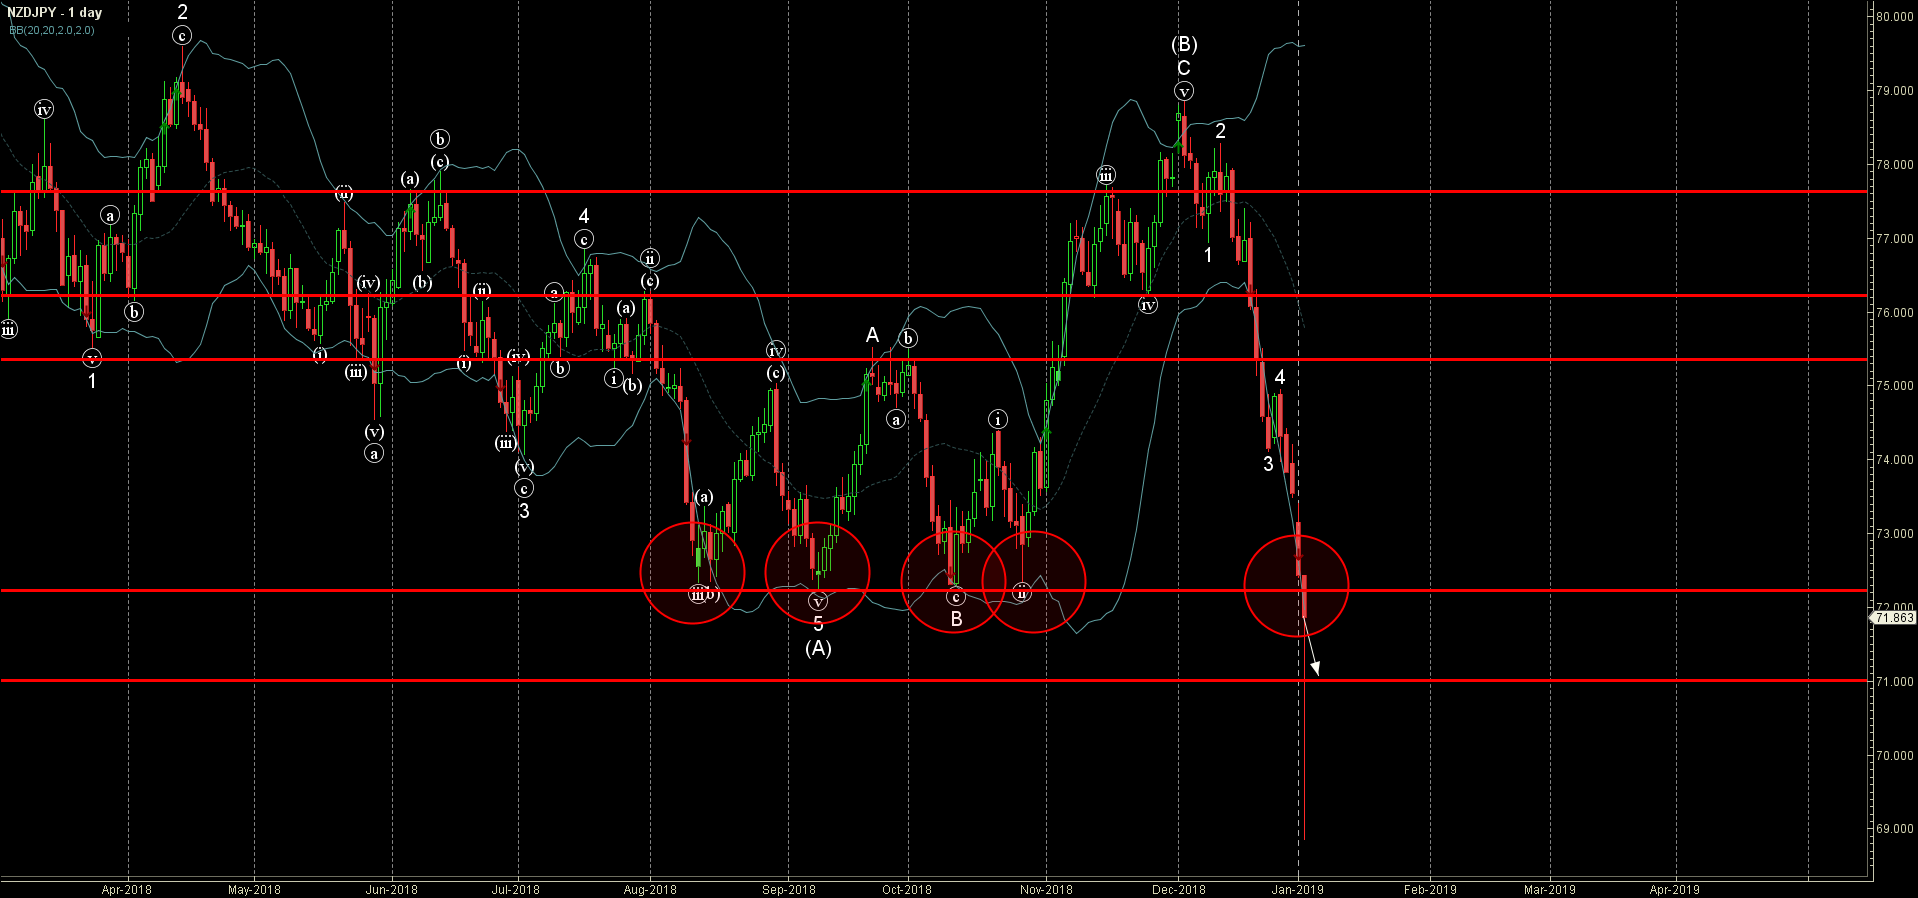
NZDJPY recently broke through the powerful multi-month support level 72.20 (which has been steadily reversing the price from the middle of August, as can be seen below).

The breakout of the support level 72.20 continues the active short-term impulse wave 5 – which belongs to the medium-term impulse wave (C) from the start of December.

NZDJPY is expected to fall further and re-test the next support level 71.00 (former support from the middle of 2016).

The FxPro Tech Analysis Team

The FxPro technical experts prepare a daily analysis of the most active currency pairs (majors, crosses, exotics) and commodities. Selected instruments are reviewed on daily trends (D1, H4), using the active Elliott Wave setups, Japanese candlesticks, indicators, and support/resistance levels.

Share
Published by
The FxPro Tech Analysis Team
Tags: NZDJPY

Recent Posts

Bitcoin can’t accelerate but won’t give up trying 

Market picture  The crypto market capitalisation fell by 1.7% in 24 hours to $2.29 trillion,…

3 hours ago

USDJPY Wave Analysis 6 May 2024

- USDJPY reversed from support zone - Likely to rise to resistance level 155.65 USDJPY…

18 hours ago

Gold Wave Analysis 6 May 2024

- Gold reversed from support zone - Likely to rise to resistance level 2400.00 Gold…

18 hours ago

Oil Bounces Locally, Global Support 5% below Spot Price

The number of operating oil rigs in the US fell by 7 to 499. This…

22 hours ago

Crypto Market Tries to Break Local Downtrend

Market picture  Crypto market capitalisation has been up 2% over the past seven days and…

1 day ago

Adobe Wave Analysis 3 May 2024

- Adobe reversed from support zone - Likely to rise to resistance level 500.00 Adobe…

4 days ago

This website uses cookies