Categories: Technical analysis

NZDJPY rising inside medium-term impulse wave (C)

  • NZDJPY rising inside medium-term impulse wave (C)
  • Further gains are likely

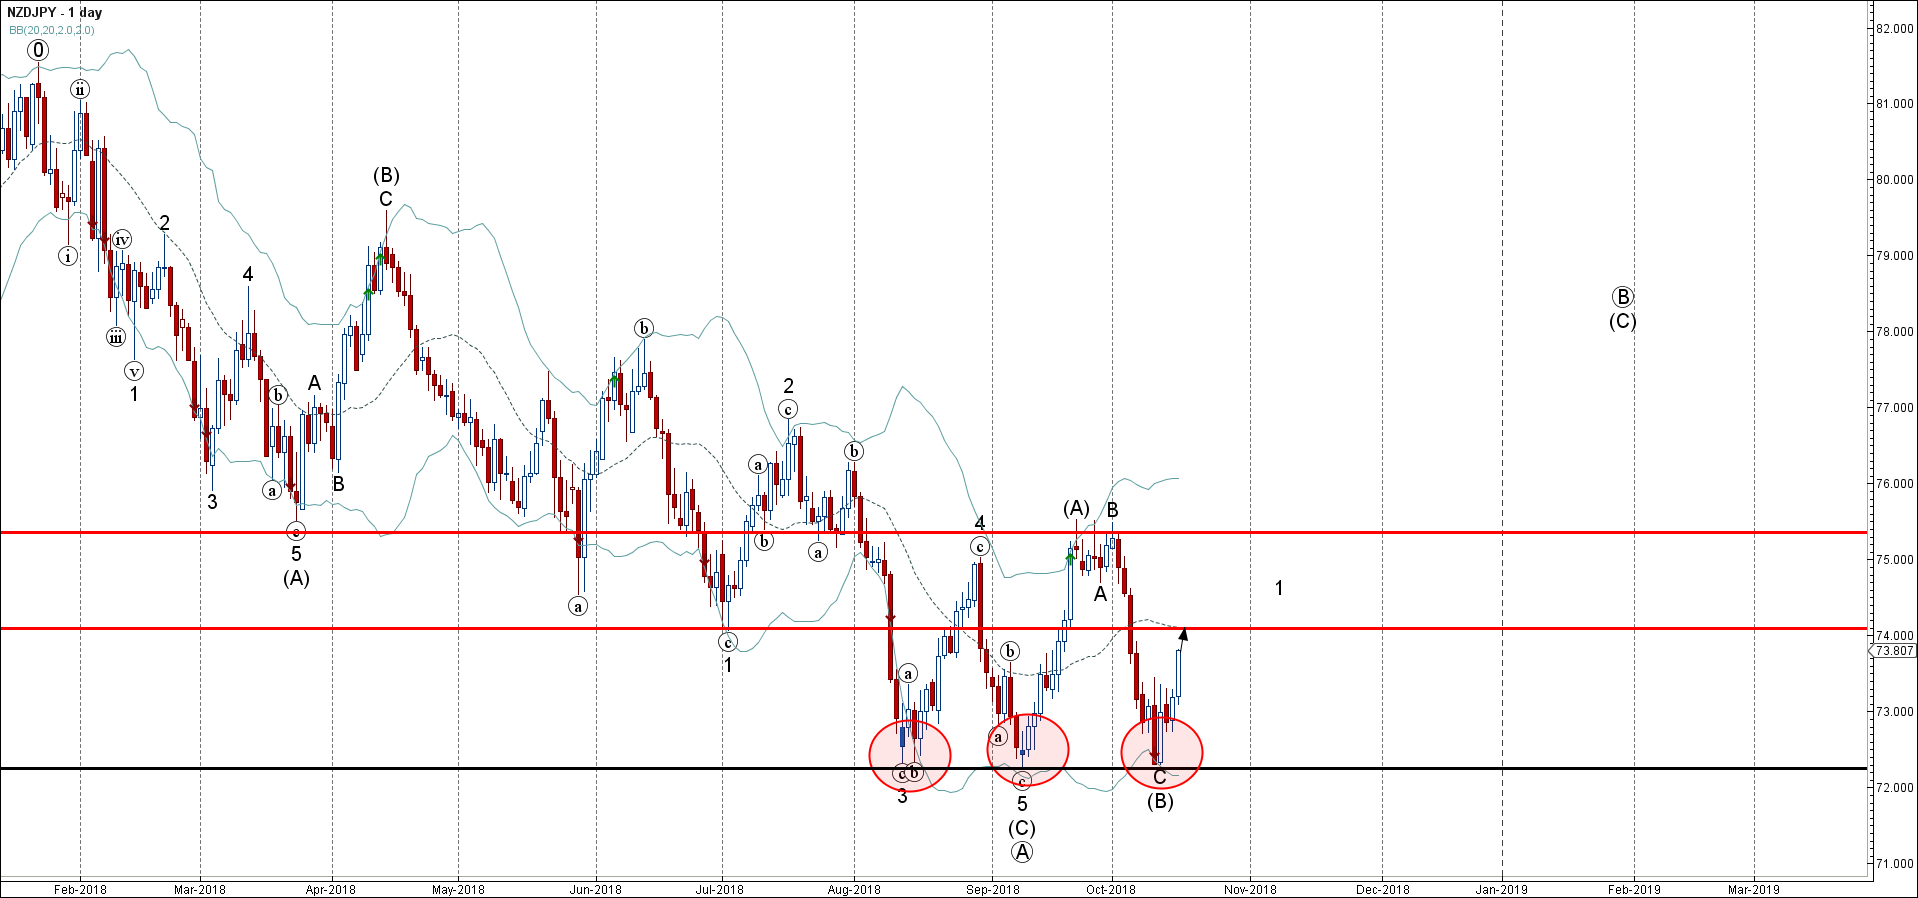
NZDJPY continues to rise inside the strong medium-term impulse wave (C), which started earlier from the combined support area lying between the major support level 72.30 (which also reversed the price in August and September) and the lower daily Bollinger Band.

The upward reversal from the aforementioned support area created the daily Japanese candlestick reversal pattern Piercing Line.

NZDJPY is expected to rise further in the active impulse wave (C) and re-test the next resistance level 74.00. Strong support remains at the support level 72.30.

The FxPro Tech Analysis Team

The FxPro technical experts prepare a daily analysis of the most active currency pairs (majors, crosses, exotics) and commodities. Selected instruments are reviewed on daily trends (D1, H4), using the active Elliott Wave setups, Japanese candlesticks, indicators, and support/resistance levels.

Share
Published by
The FxPro Tech Analysis Team
Tags: NZDJPY

Recent Posts

Video: Dollar and Indices are trying to find footing after the fall

The dollar experienced a sell-off but rallied back up by the end of the week.…

3 days ago

What is next: BoJ, Fed, SNB & BoE Rates

The new week will be packed with economic data and decisions from key central banks.…

3 days ago

Dollar attempts to rebound after oversold conditions

Despite economic factors working against the dollar, its oversold condition helped it this week or…

3 days ago

USDCAD Wave Analysis – 14 March 2025

USDCAD: ⬇️ Sell - USDCAD reversed from key resistance level 1.4500 - Likely to fall…

3 days ago

Solana Wave Analysis – 14 March 2025

Solana: ⬆️ Buy - Solana reversed from the long-term support level 113.75 - Likely to…

3 days ago

Adobe Wave Analysis – 13 March 2025

Adobe: ⬇️ Sell - Adobe broke round support level 400.00 - Likely to fall to…

3 days ago

This website uses cookies