Categories: Technical analysis

NZDJPY broke daily up channel

  • NZDJPY broke daily up channel
  • Further losses are likely

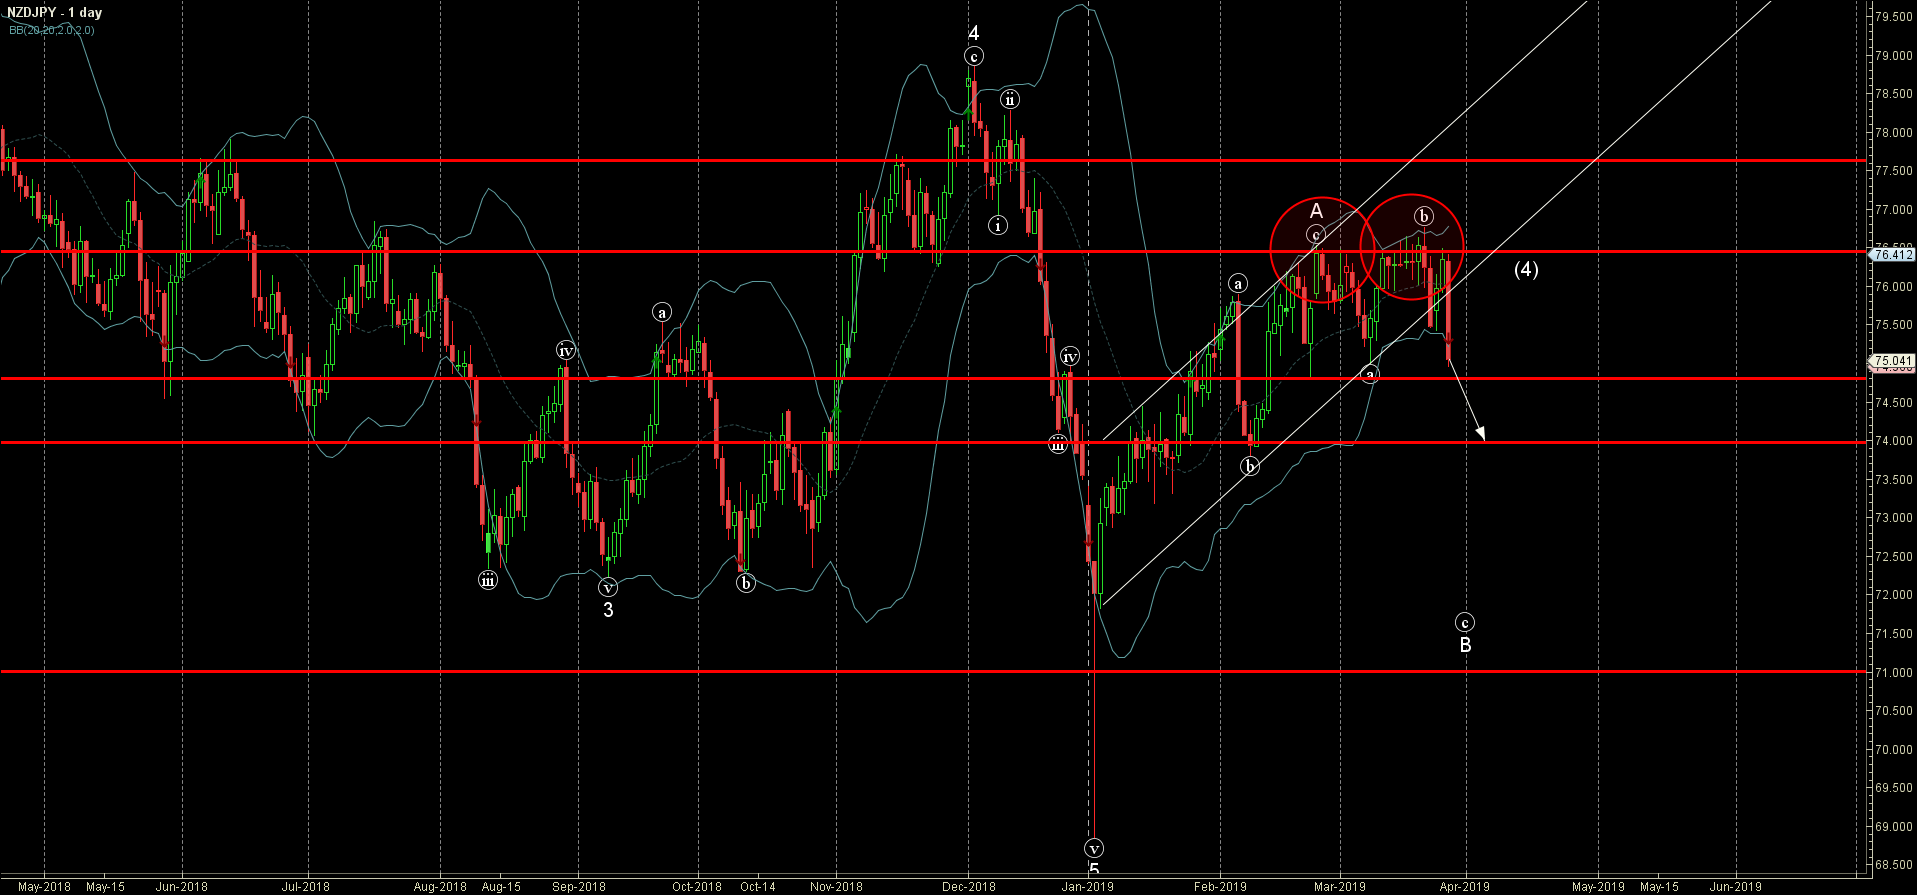
NZDJPY recently broke the support trendline of the daily up channel from the start of January.

The breakout of this up channel follows the earlier downward reversal from the key resistance level 76.50 (which has been reversing the price from the end of February).

NZDJPY is expected to fall further and re-test the next support level 74.80 (low of the previous wave (a)) – the breakout of which can lead to further losses toward 74.00.

AddThis Website Tools
The FxPro Tech Analysis Team

The FxPro technical experts prepare a daily analysis of the most active currency pairs (majors, crosses, exotics) and commodities. Selected instruments are reviewed on daily trends (D1, H4), using the active Elliott Wave setups, Japanese candlesticks, indicators, and support/resistance levels.

Share
Published by
The FxPro Tech Analysis Team
Tags: NZDJPY

Recent Posts

Crypto Market Escapes from Fear

Market Overview The crypto market has gained around 2% over the past seven days, with…

5 hours ago

Nike Wave Analysis – 21 April 2025

Nike: ⬆️ Buy - Nike reversed from the long-term support level 52.60 - Likely to…

16 hours ago

Natural Gas Wave Analysis – 21 April 2025

Natural gas: ⬇️ Sell Natural gas broke support area Likely to fall to support level…

16 hours ago

EURUSD Wave Analysis – 21 April 2025

EURUSD: ⬆️ Buy - EURUSD broke the resistance area - Likely to test resistance level…

18 hours ago

USDJPY Wave Analysis – 21 April 2025

USDJPY: ⬇️ Sell - USDJPY broke support area - Likely to fall to support level…

18 hours ago

What is next: Euro Area PMI and US Durable Goods Orders

The following economic data events are worth paying attention to in the new week. Wednesday…

1 day ago