Categories: Technical analysis

NZDCHF Wave Analysis – 7 April 2023


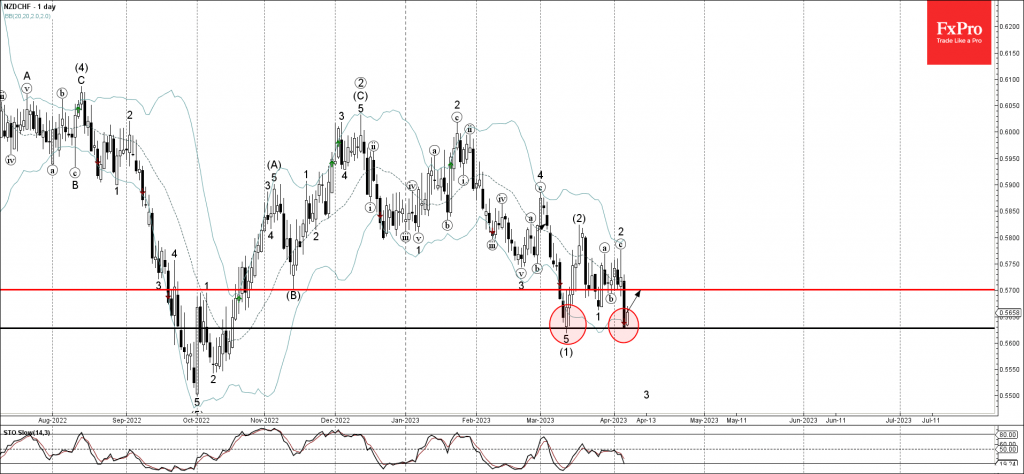
• NZDCHF reversed from key support level 0.5630

• Likely to rise to resistance level 0.5700

NZDCHF recently reversed up from the key support level 0.5630 (previous monthly low from the middle of March) intersecting with the lower daily Bollinger Band.

The upward reversal from the support level 0.5630 stopped the previous short-term impulse wave 3 – which belongs to the intermediate impulse wave (3) from March.

Given the oversold daily Stochastic, NZDCHF can then be expected to rise further toward the next resistance level 0.5700.

The FxPro Tech Analysis Team

The FxPro technical experts prepare a daily analysis of the most active currency pairs (majors, crosses, exotics) and commodities. Selected instruments are reviewed on daily trends (D1, H4), using the active Elliott Wave setups, Japanese candlesticks, indicators, and support/resistance levels.

Share
Published by
The FxPro Tech Analysis Team
Tags: NZDCHF

Recent Posts

Forex has set its priorities

In 2026, experts favour the yen, see modest euro growth, and expect pressure on the…

2 hours ago

Bear market rebound in crypto is likely to continue

Crypto rebounds continue; Bitcoin faces resistance, with a mixed market outlook ahead, as regulatory changes…

3 hours ago

Coca-Cola Wave Analysis – 4 December 2025

Coca-Cola: ⬇️ Sell - Coca-Cola reversed from long-term resistance level 73.25 - Likely to fall to…

16 hours ago

DraftKings Wave Analysis – 4 December 2025

DraftKings: ⬆️ Buy - DraftKings reversed from support zone - Likely to rise to resistance level…

16 hours ago

NVDA Wave Analysis – 4 December 2025

NVDA: ⬆️ Buy - NVDA reversed from support zone - Likely to rise to resistance level…

17 hours ago

Basic Attention Token Wave Analysis – 4 December 2025

Basic Attention Token: ⬇️ Sell - Basic Attention Token reversed from resistance level 0.2800 - Likely…

17 hours ago

This website uses cookies